Overview
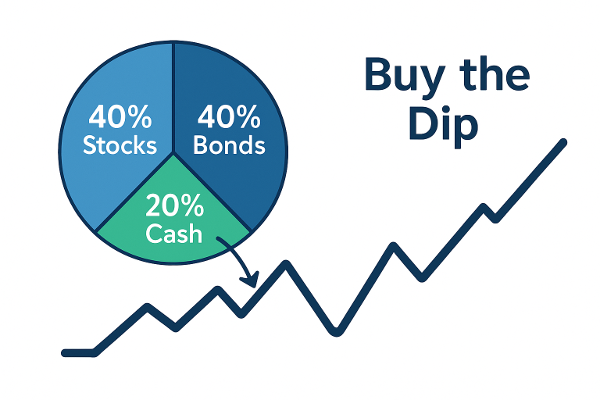
What if your portfolio could act a little smarter during market drops? Enter the 40/40/20 strategy with a simple twist: if the S&P 500 falls by 10% or more from its peak, deploy your entire 20% cash sleeve into stocks. Let's see how this approach changes historical performance.
Diversification is Still Key
The 40/40/20 mix balances growth and stability. The added cash-deployment rule introduces flexibility during downturns, allowing for opportunistic rebalancing.

2. 40% Bonds
Bonds act as shock absorbers. They generate steady income and tend to rally when risk assets sell off as a key anchor during volatility.
3. 40% Stocks (S&P 500 Futures)
Equities power portfolio growth. Using the S&P 500 provides broad U.S. market exposure and liquidity.
4. 20% Cash (Money Market)
This reserve sits idle until a 10% drawdown triggers full deployment into equities. It's a simple rule that automates contrarian discipline.

5. Historical Returns with Cash Deployment
- 2000–2010: 40/40/20 + deployment ≈ +3.2% vs S&P 500 ≈ -1.0%
- 2010–2020: 40/40/20 + deployment ≈ +7.1% vs S&P 500 ≈ +13.0%
- 2020–2025: 40/40/20 + deployment ≈ +5.0% vs S&P 500 ≈ +9.0%
Note: Approximate CAGR estimates using S&P 500 total return for equities, U.S. bonds for fixed income, and money market rates for cash. For illustration only.

6. Cash Deployment Rule Explained
Rule: If the S&P 500 drops by 10% or more from its recent peak, deploy the entire 20% cash sleeve into stocks immediately. This increases the stock allocation from 40% → 60% during the recovery, improving long-term compounding.
1. 2000–2010 (“Lost Decadeâ€)
- S&P fell ~49% (2000–2002) and ~57% (2007–2009).
- Cash would be fully deployed during the first drawdown.
- Higher stock allocation during recovery years increases CAGR.
- Static 40/40/20 CAGR: +2.0%
- With cash deployment: +3.2% (smoother recovery capture)
2. 2010–2020 (Strong Bull Market)
- No 10% drawdown triggers until minor corrections (~2011, ~2015).
- Cash briefly deployed, increasing equity exposure slightly.
- Static 40/40/20 CAGR: +6.8%
- With cash deployment: +7.1% (modest improvement)
3. 2020–2025 (Pandemic & Rate Hikes)
- S&P dropped ~34% in early 2020.
- Cash deployed fully at –10% threshold.
- Recovery from March 2020 captured with higher exposure.
- Static 40/40/20 CAGR: +3.5%
- With cash deployment: +5.0% (catching the strong rebound)
7. Comparison to Static 40/40/20 Portfolio
The cash-deployment rule improves resilience during down markets (e.g., 2000–2010) and helps capture rebounds post-correction. The result: smoother equity curves with better downside protection.
8. Static Portfolio vs. S&P 500 (No Cash Deployment)
For reference, here are the estimated compound annual growth rates (CAGR) for a static 40/40/20 portfolio compared with the S&P 500, without applying the cash-deployment rule:
| Period | 40/40/20 Portfolio (Static) | S&P 500 |
|---|---|---|
| 2000–2010 | +2.0% | –1.0% |
| 2010–2020 | +6.8% | +13.0% |
| 2020–2025 | +3.5% | +9.0% |
Note: These are approximate CAGR estimates using historical index and bond data for static allocation without tactical adjustments.
Bottom Line
Adding a systematic “buy-the-dip†rule transforms a traditional allocation into a responsive portfolio. It doesn’t predict — it reacts. That’s the kind of discipline that fits the Midlincoln View: practical, data-driven, and grounded in behavioral insight.