|
|
|
|


Top 20 Long Index Ideas YTD From Best to Worst
| objective | YTD |
| HEALTH CARE | 11.92 |
| MIDDLE EAST REGION | 9.84 |
| HEALTH CARE SECTOR | 7.53 |
| ISRAEL | 6.15 |
| SPECIALTY | 6.01 |
| GCC | 5.70 |
| AGGRESSIVE ALLOCAT00004E4BION | 4.37 |
| EVENT DRIVEN DIVERSIFIED | 4.37 |
| MACRO SYSTEMATIC DIVERSIFIED | 4.37 |
| MANAGED FUTURES CURRENCY | 4.37 |
| MANAGED FUTURES DISCRETIONARY | 4.37 |
| MANAGED FUTURES SYSTEMATIC | 4.37 |
| MUNI CA INTERMEDIATE AND SHORT | 4.37 |
| MUNI CALIFORNIA LONG | 4.37 |
| MUNI HIGH YIELD | 4.37 |
| MUNI NATIONAL INTERMEDIATE | 4.37 |
| MUNI NATIONAL SHORT | 4.37 |
| MUNI NEW YORK LONG | 4.37 |
| MUNI NY INTERMEDIATE AND SHORT | 4.37 |
| MUNI SINGLE STATE INTERMEDIATE | 4.37 |
Top 20 Short Index Ideas YTD From Best to Worst
| objective | YTD |
| TURKEY | -39.50 |
| ARGENTINA | -27.39 |
| SOUTH AFRICA | -20.31 |
| MEXICO | -17.09 |
| PHILIPPINES | -16.24 |
| FRANCE | -16.13 |
| IRELAND | -15.93 |
| PRECIOUS METAL SECTOR | -15.65 |
| THEMATIC | -15.49 |
| CHILE | -15.37 |
| KOREA | -15.30 |
| MATERIALS | -15.27 |
| FINANCIAL | -15.08 |
| INDUSTRIAL METALS | -14.83 |
| BELGIUM | -14.18 |
| ITALY | -13.70 |
| COLOMBIA | -13.19 |
| AGGREGATE BOND LONG | -12.85 |
| FOREIGN CORPORATE BOND | -12.01 |
| AGGREGATE BOND SHORT | -12.00 |
Combined Performance of Tracked Indexes by Index Provider Top 20 Winners
| sourcename | ytd |
| The Association of Banks in Si | 17.8 |
| ICE Benchmark Administration | 12.780000000000001 |
| Saudi Arabian Stock Exchange | 9.84 |
| Fundacao Getulio Vargas | 8.71 |
| NYSE AMEX | 8.475 |
| Bermuda Stock Exchange | 7.35 |
| Russell Equity Indices | 5.08 |
| Kuwait Stock Exchange | 4.21 |
| Cohen and Steers | 4.1899999999999995 |
| Morningstar | 4.090909090909092 |
| IBGE | 3.81 |
| Russell | 3.6232000000000006 |
| CRSP | 3.1319999999999997 |
| Deutsche Bank Securities Inc. | 2.01 |
| Chicago Board Options Exchange | 1.015 |
| London Metal Exchange - LME | 0.8399999999999999 |
| Morgan Stanley | -0.26 |
| Mauritius Stock Exchange | -0.27 |
| Bahrain Bourse | -0.41 |
| Analistas Financieros Internac | -0.525 |
Combined Performance of Tracked Indexes by Index Provider Top 20 Losers
| sourcename | ytd |
| Istanbul Stock Exchange | -42.91 |
| Shenzhen Stock Exchange | -31.9 |
| Shanghai Stock Exchange | -22.6675 |
| Irish Stock Exchange | -22.19 |
| NASDAQ OMX PSX | -21.36 |
| NASDAQ OMX Iceland | -19.67 |
| Nigerian Stock Exchange | -19.59 |
| Colombo Stock Exchange | -19.08 |
| National Stock Exchange of Ind | -17.53 |
| Bolsa de Comercio de Santiago | -17.06 |
| Bulgaria Stock Exchange | -16 |
| FNGuide Inc | -15.421363636363635 |
| London Bullion Market Associat | -14.71 |
| NYSE Euronext Brussels | -14.58 |
| Cushing | -14.26 |
| Markit | -13.173333333333334 |
| Stuttgart Stock Exchange | -13.08 |
| Tokyo Commodity Exchange | -13.01 |
| CQG | -12.97 |
| Bolsa de Valores de Colombia | -12.59 |
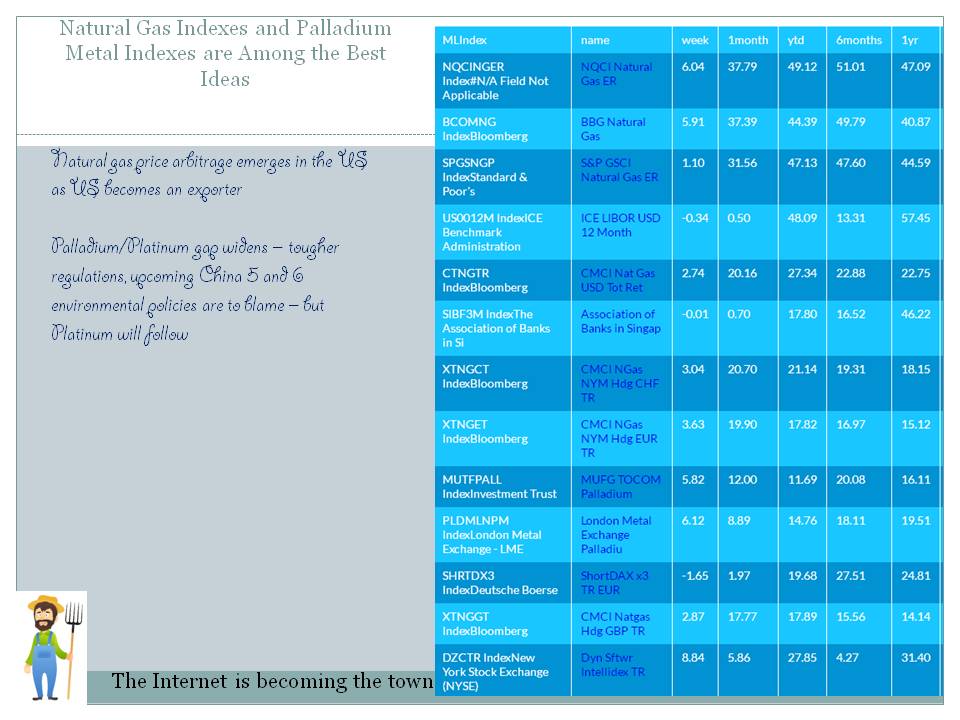
Chart: Index Ideas That Made Money in 2018Most of the conventional Index Destinations were Money losers in 2018 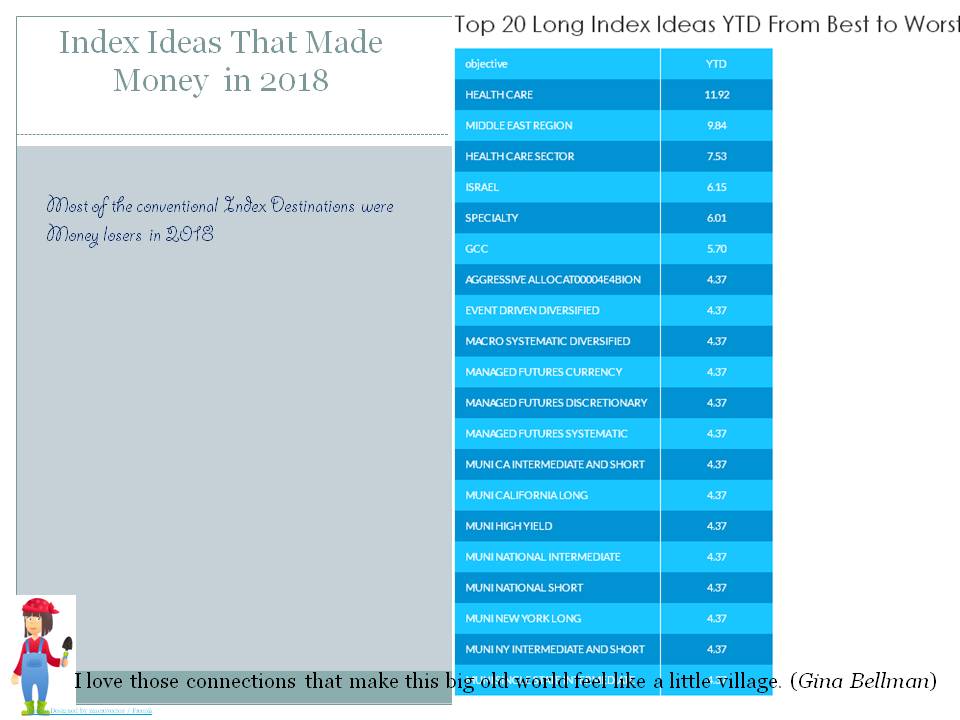 Source: ML Download file in Power PointKey Topics and NewsNatural Gas Indexes and Palladium Metal Indexes are Among the Best Ideas
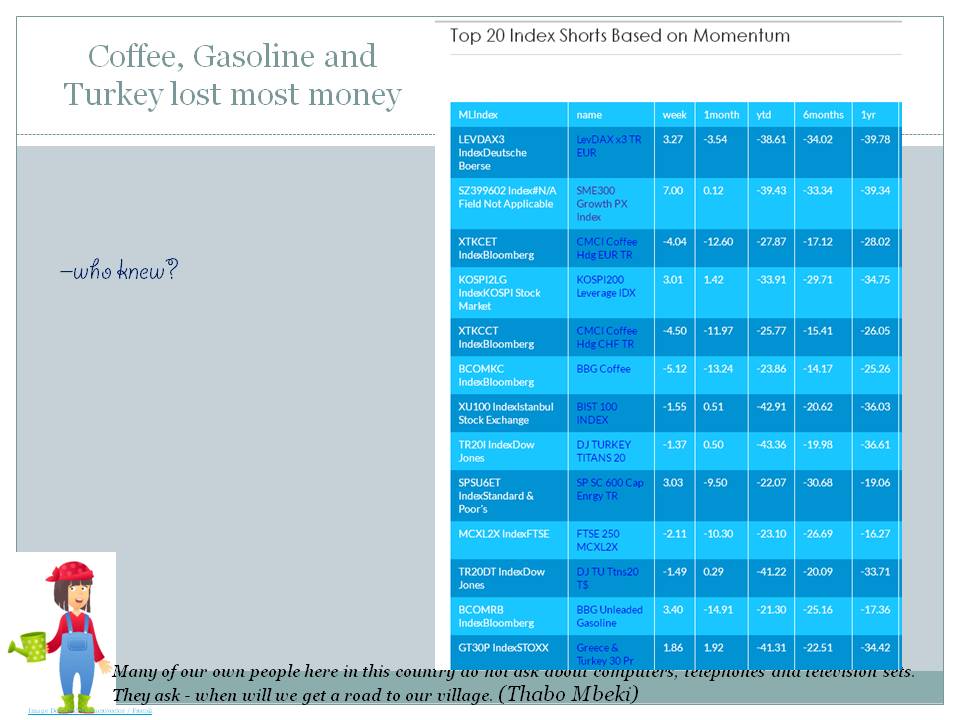
Natural gas price arbitrage emerges in the US as US becomes an exporter Palladium/Platinum gap widens – tougher regulations, upcoming China 5 and 6 environmental policies are to blame – but Platinum will follow  Source: ML Coffee, Gasoline and Turkey lost most money
–who knew?  Source: ML FTSE 100 and FTSE 250 Rebalancing
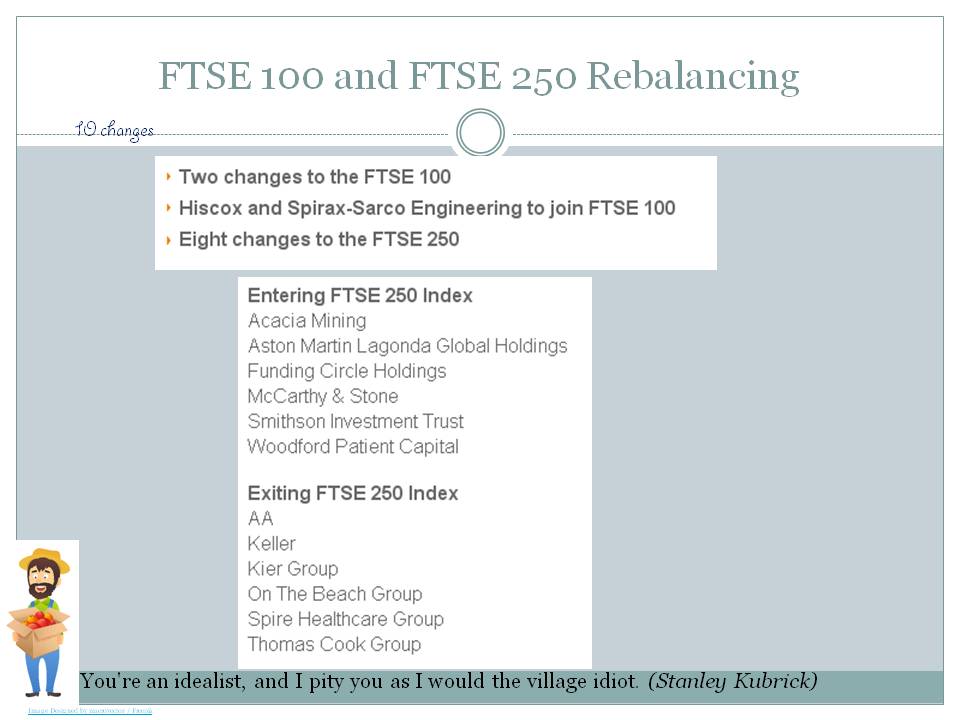
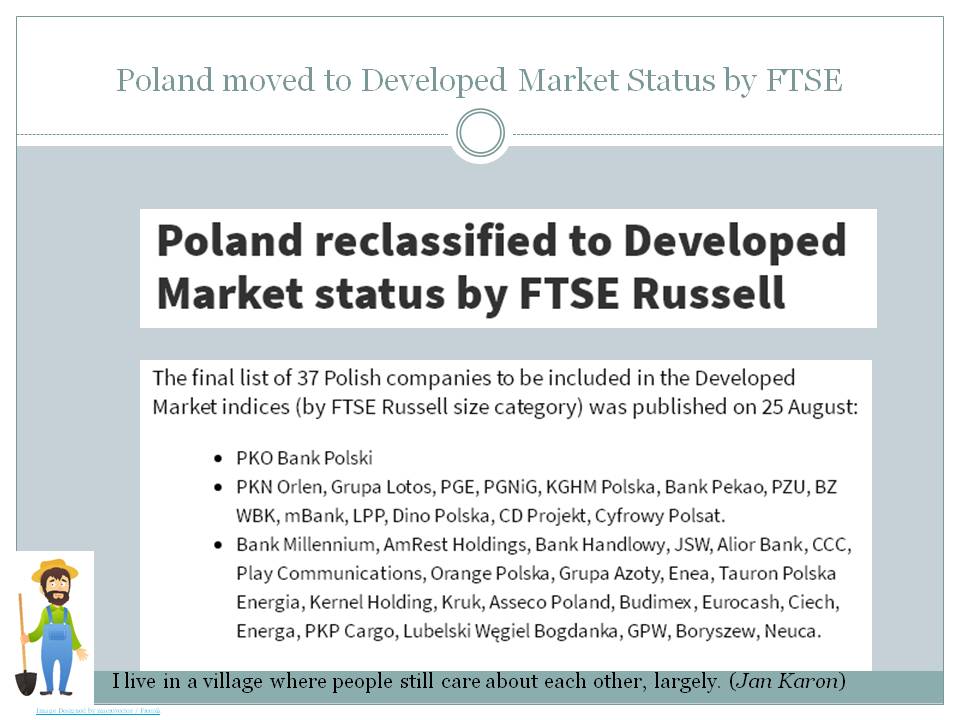
10 changes  Source: ML Poland moved to Developed Market Status by FTSE
 Source: ML Natural Gas prices in the US are surging
What are the factors behind the surge? Arbitrage between US and European prices? 3 LNG terminals are operating in the US and 25 more proposed.  Source: ML Recent Index Atlas Ideas ChartArtIndex Rebalancing NewsMSCI Standard & Poor's Index Hang Seng FTSE Bloomberg Indices Dow Jones Moex Indexes Index Futures TradingTop 20 Index Longs Based on Momentum
Top 20 Index Shorts Based on Momentum
Best Indexes last Week
Worst Indexes last Week
Best Indexes last Month
Worst Indexes last Month
Best Indexes YTD
Worst Indexes YTD
Best Indexes 1yr
Worst Indexes 1yr
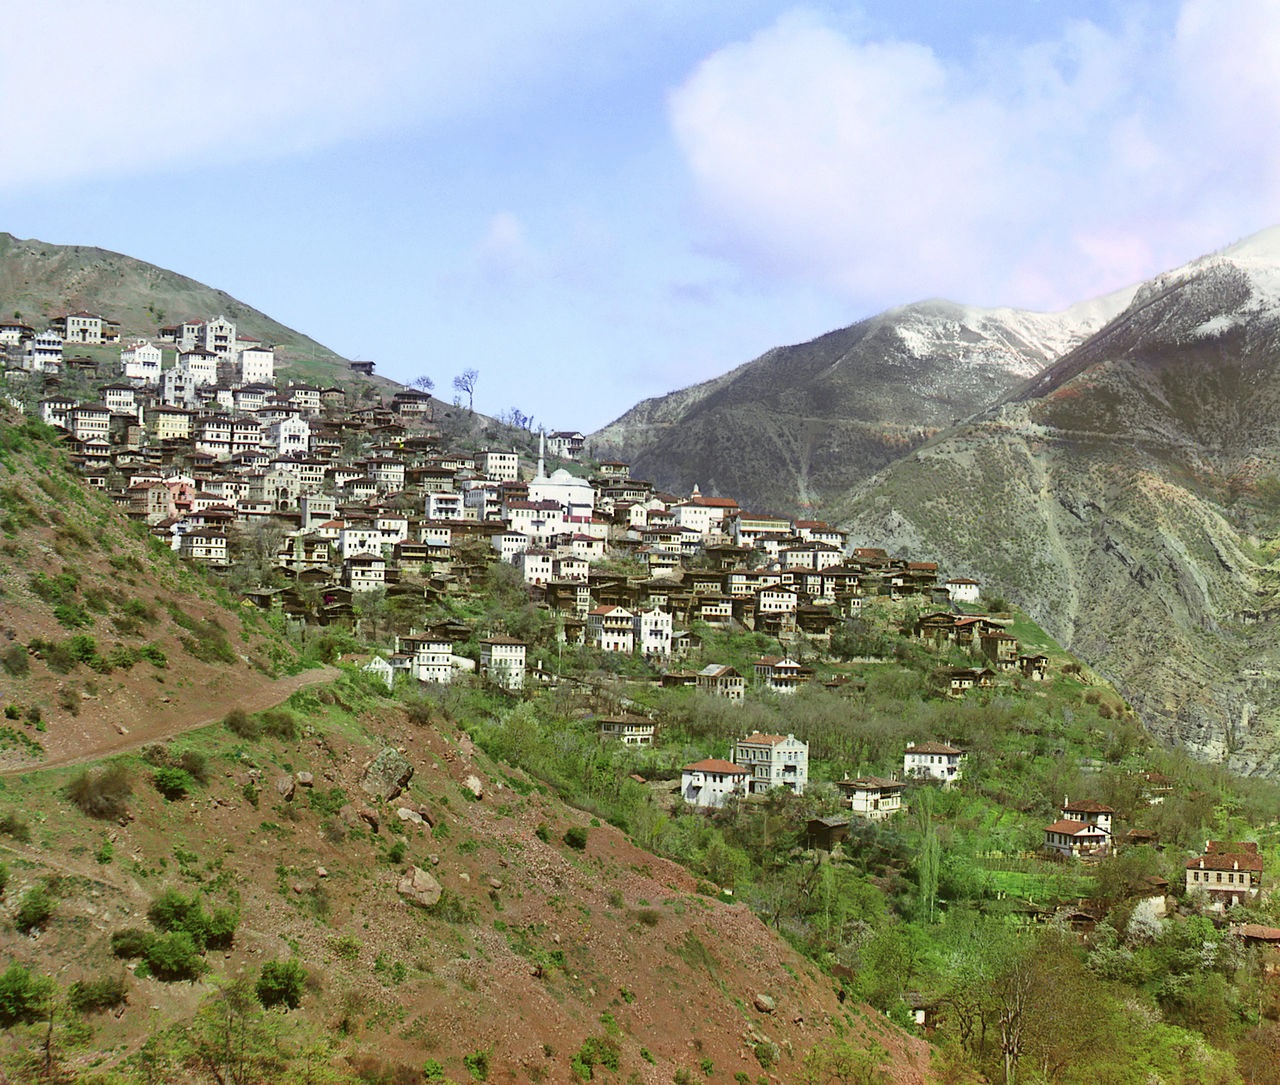
Latest ML ComicsRecent ML Rural Highlights. Small Towns and Villages
|


