Strategy
February 14, 2017
MidLincoln Chart Art
Mining
for Market Ideas
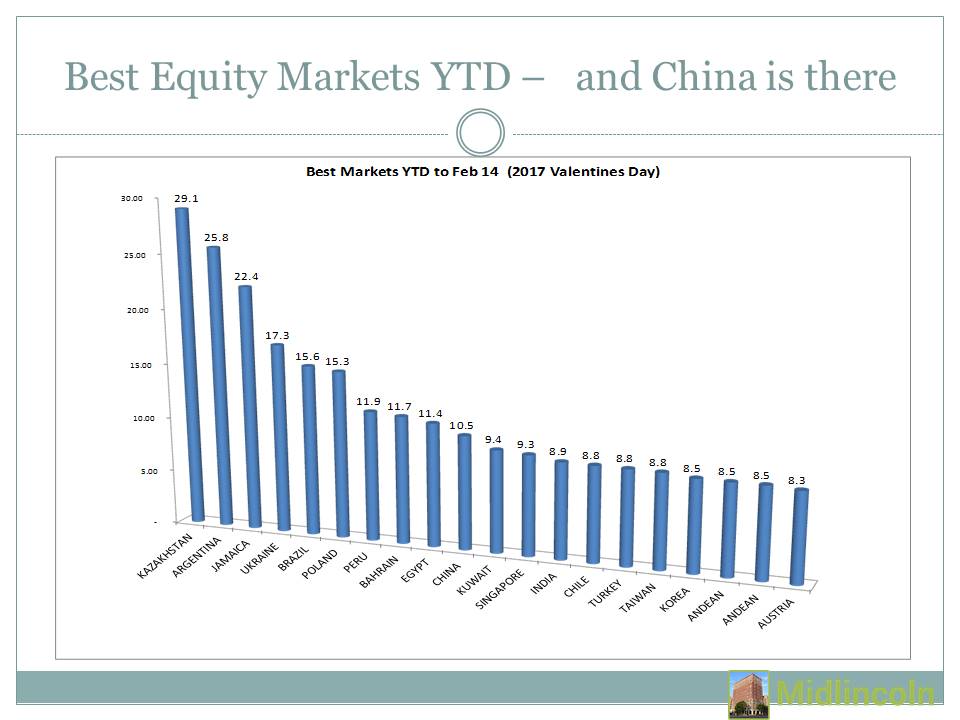
Best 20 Equity Markets YTD
Download file in Power Point
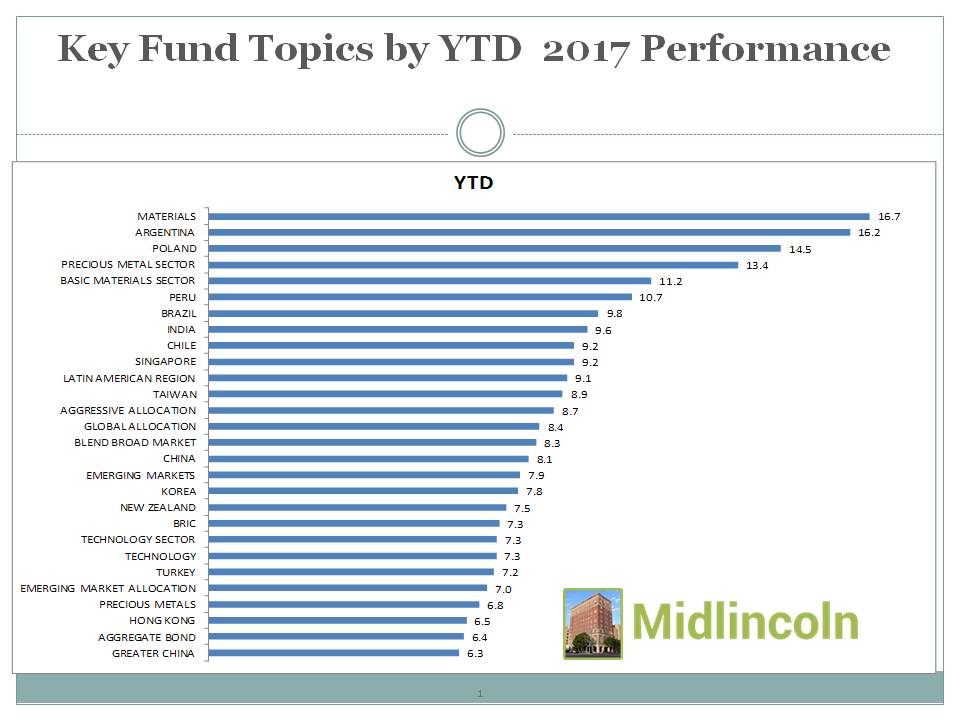
Key Performing Fund Ideas
Download file in Power Point
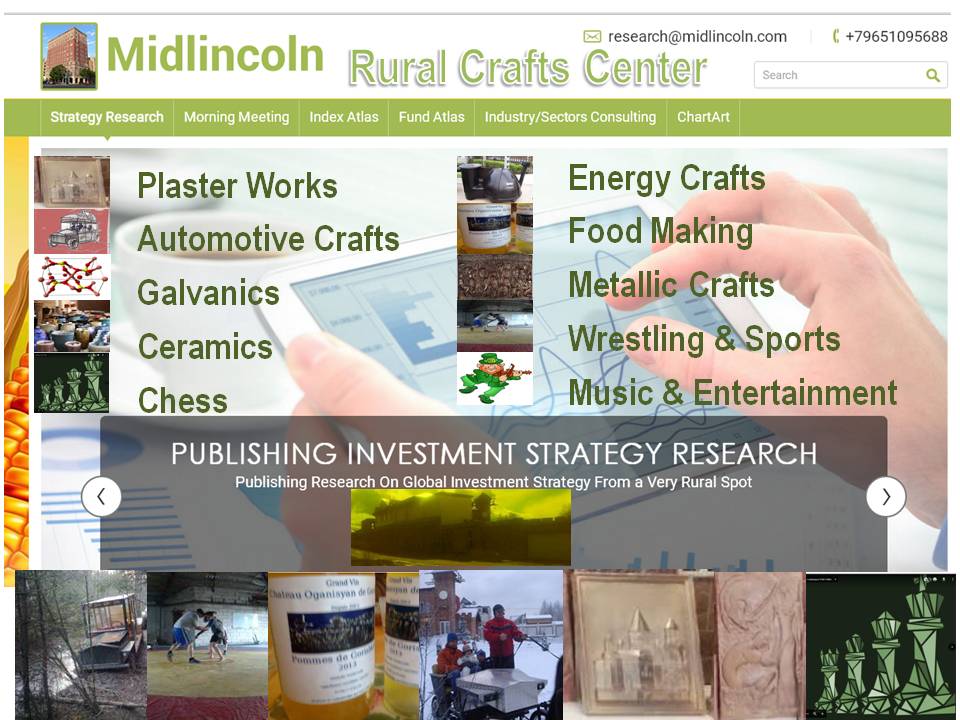
MidLincoln Rural Crafts Center
Download file in Power Point
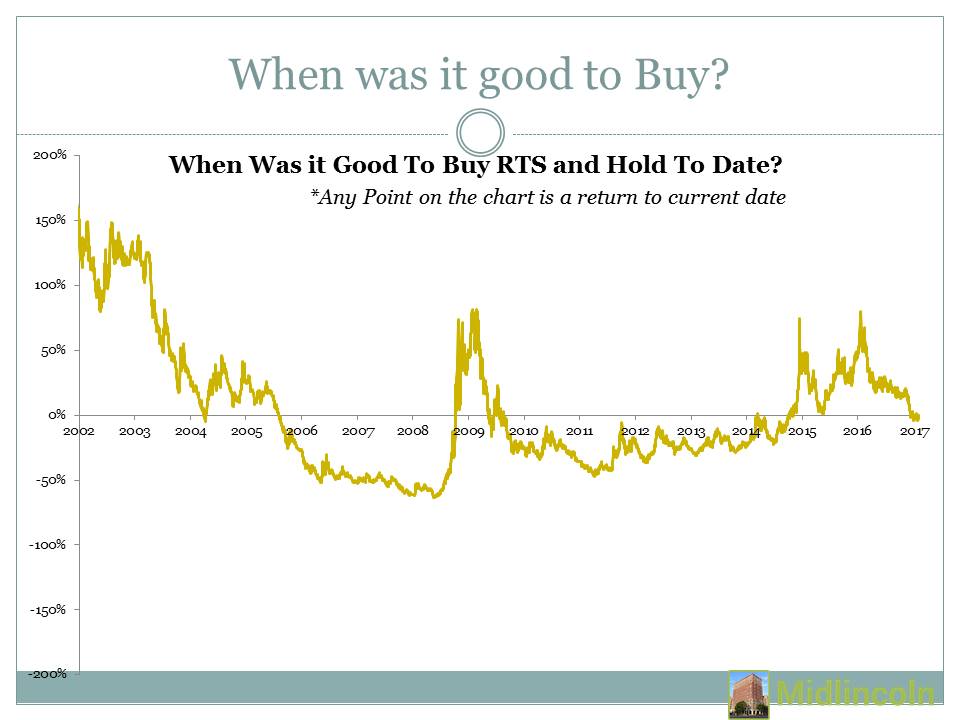
When Was It Good To Buy RTS and Hold To Date?
Download file in Power Point
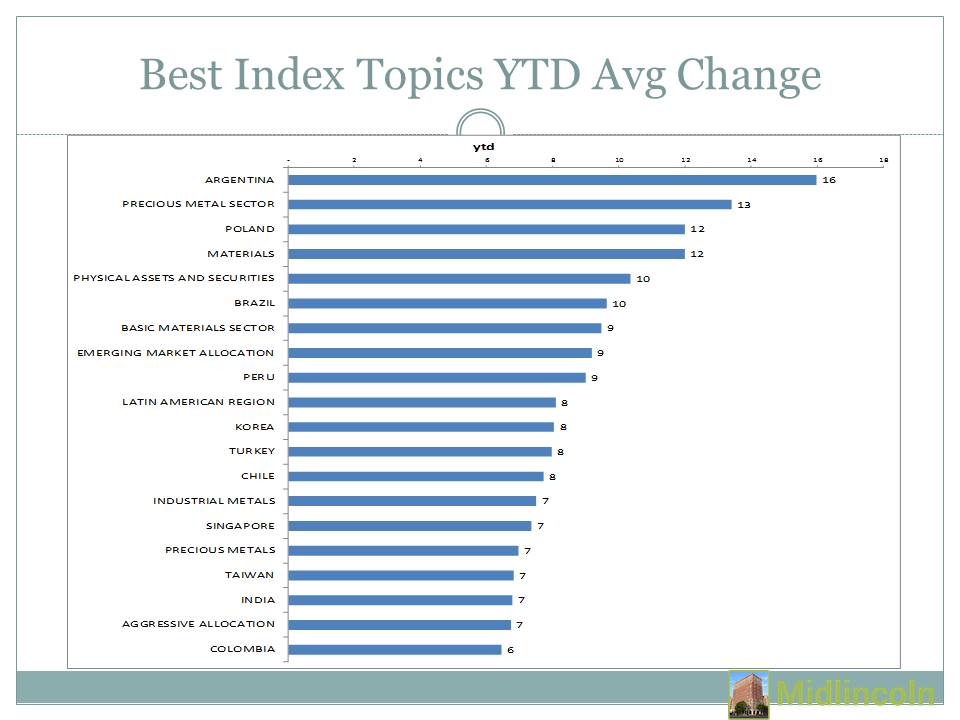
Best Topics YTD by Index Family Avg Return
Download file in Power Point
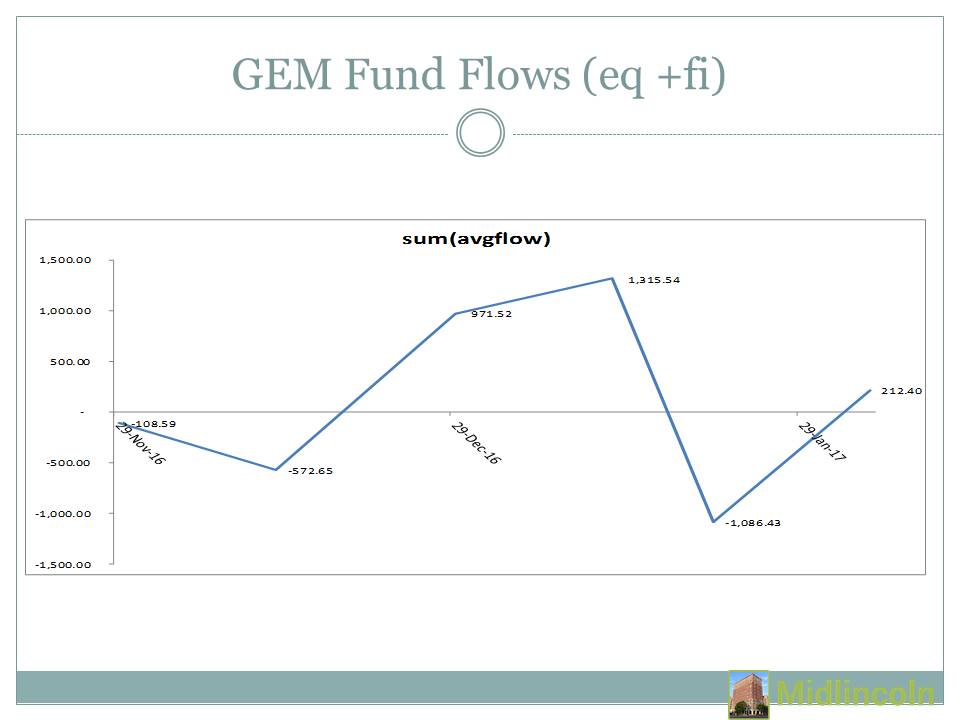
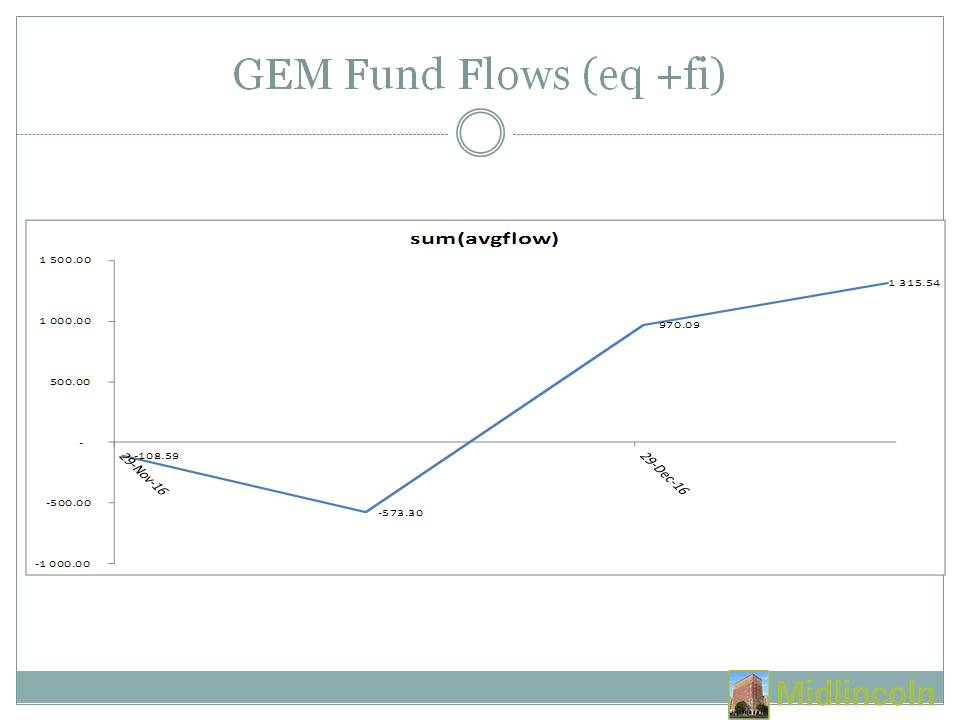
Emerging Market Fund Flow Turn Positive
Download file in Power Point
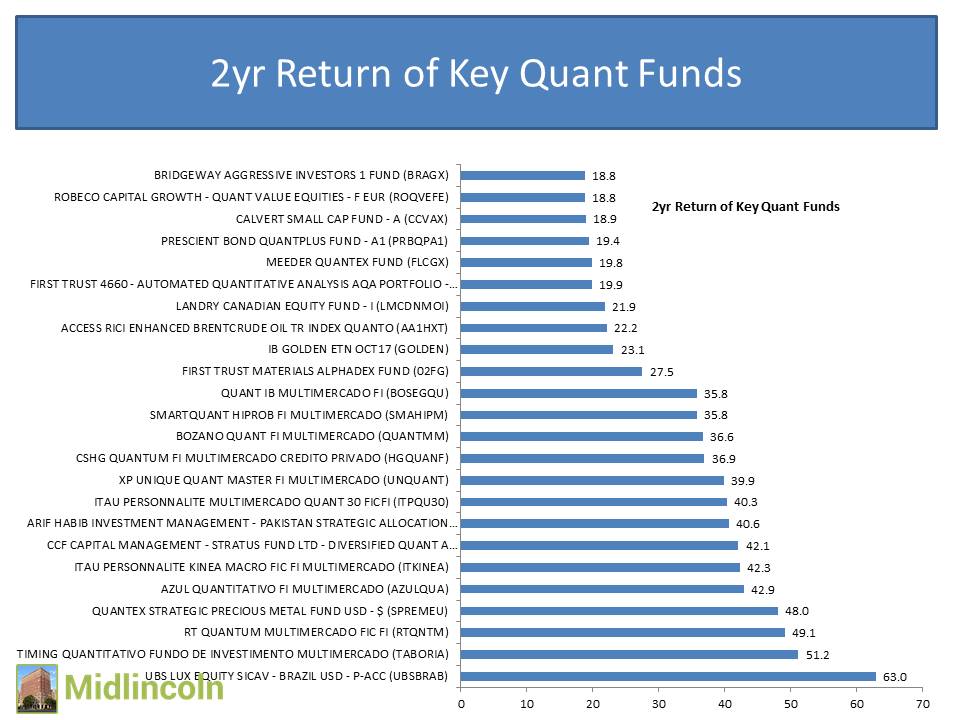
2 yr Return of Key Quant Funds
Download file in Power Point
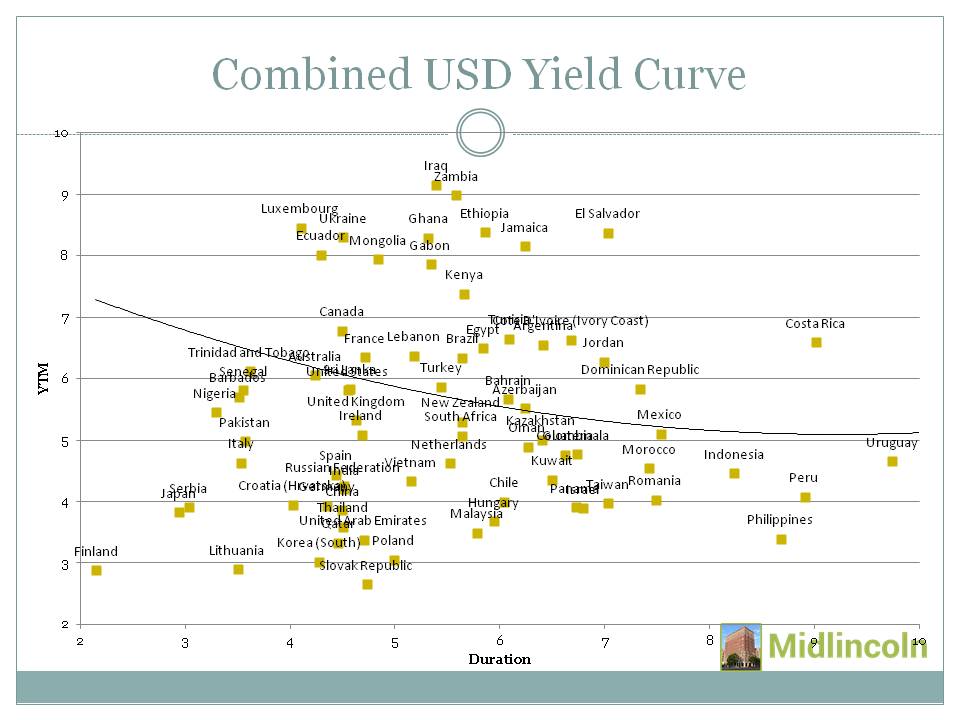
Combined Yield Curve By Country
Download file in Power Point
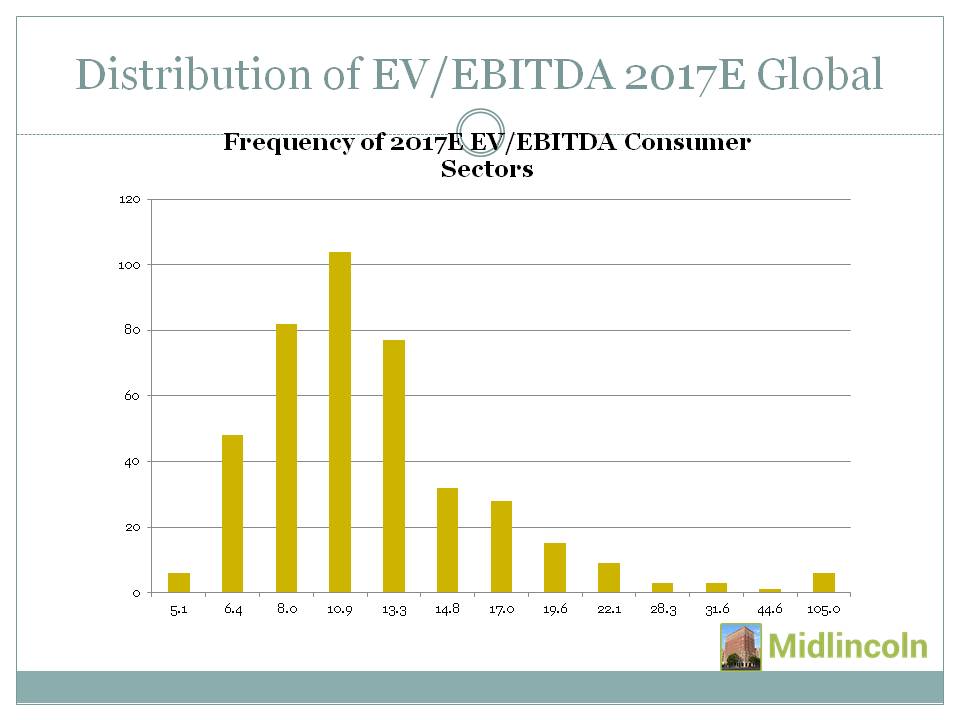
EV/EBITDA 2017E Distribution for Consumer Sectors
Download file in Power Point
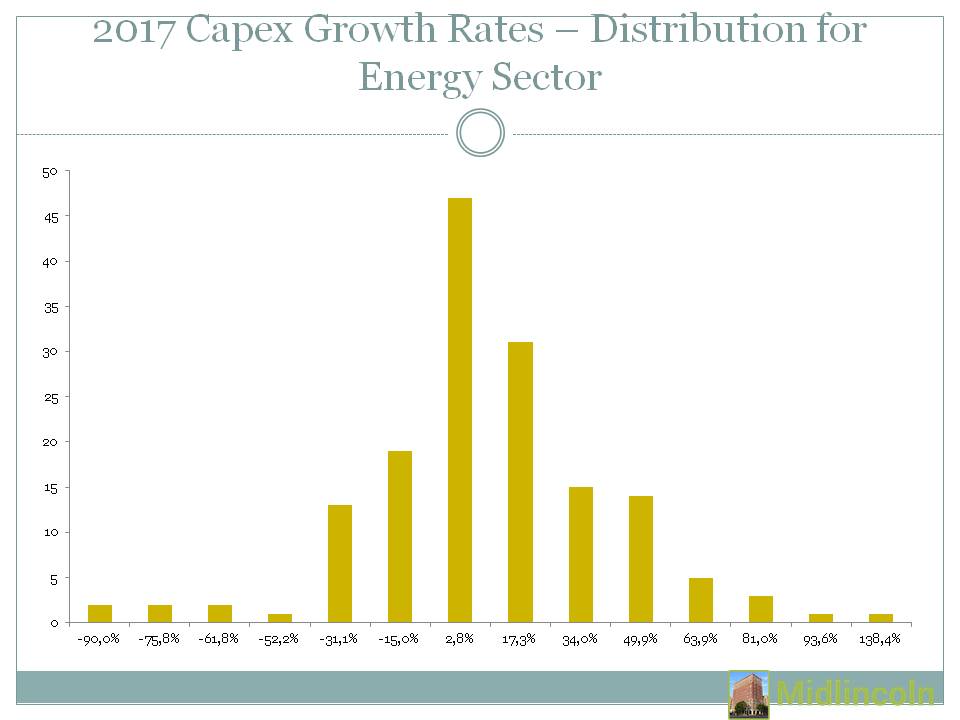
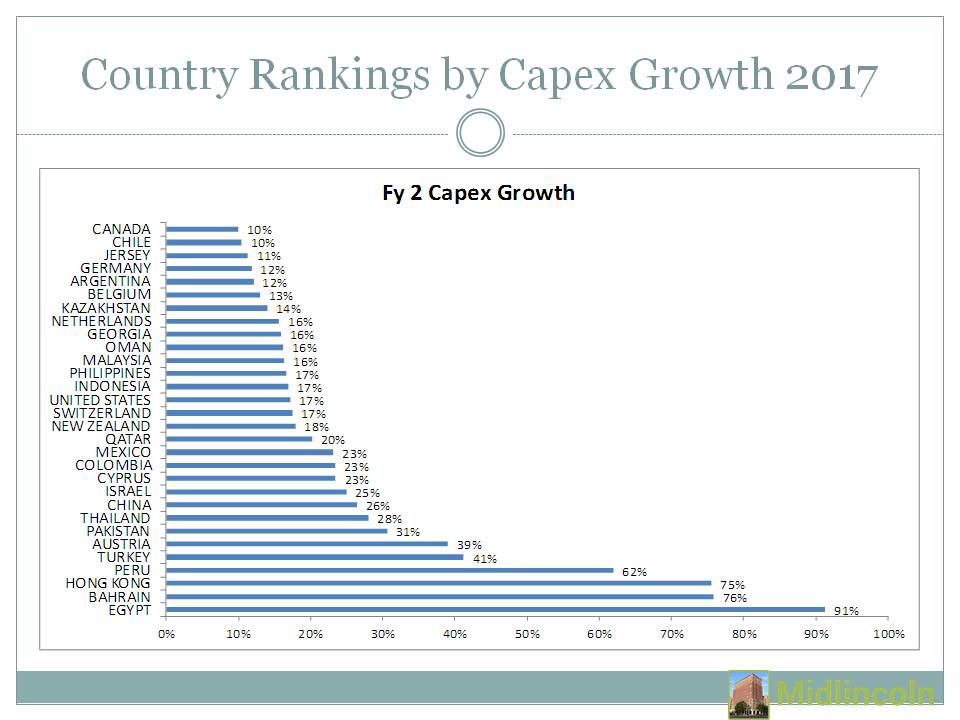
2017 Capex Growth Rates � Distribution for Energy Sector
Download file in Power Point
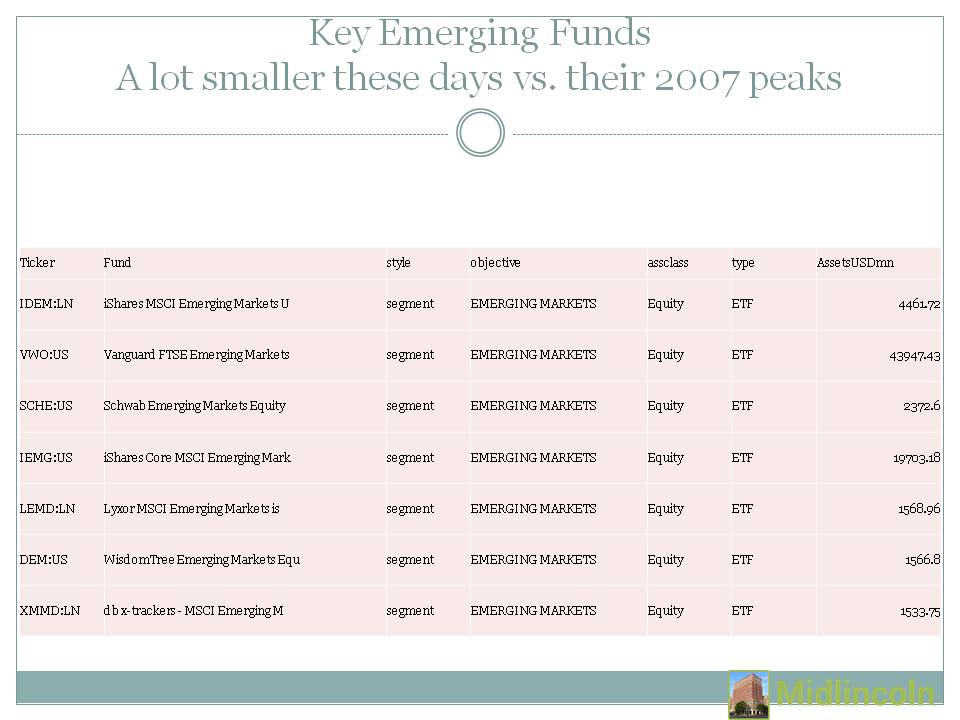
Some of the larger GEM Funds - a lot smaller these days vs. 2007 peaks
Download file in Power Point
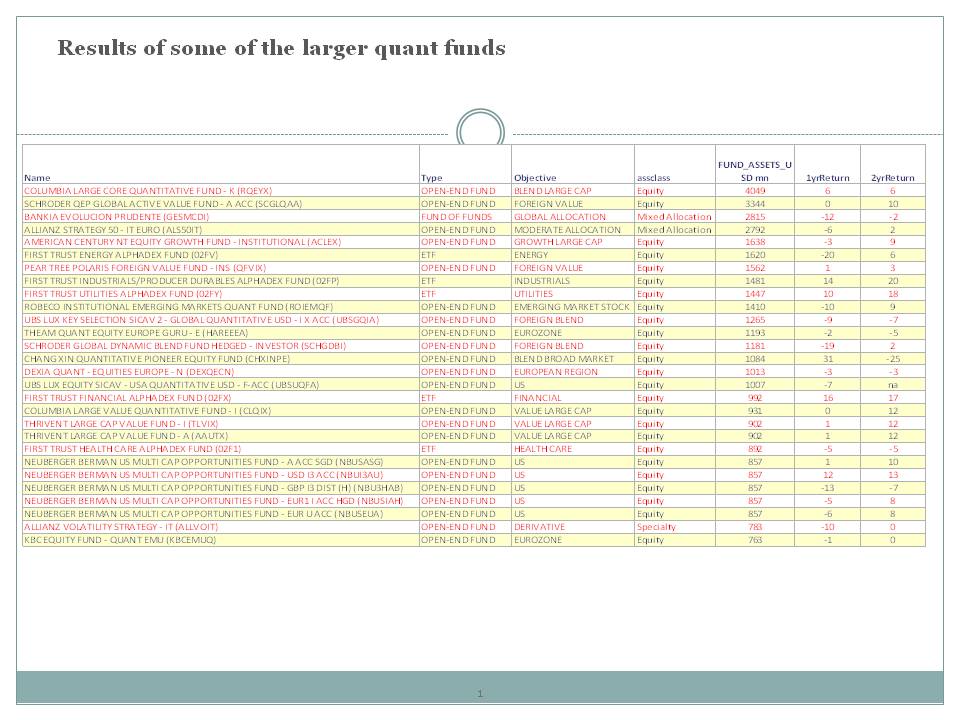
Results of some of the larger quant or quasi quant funds
Download file in Power Point
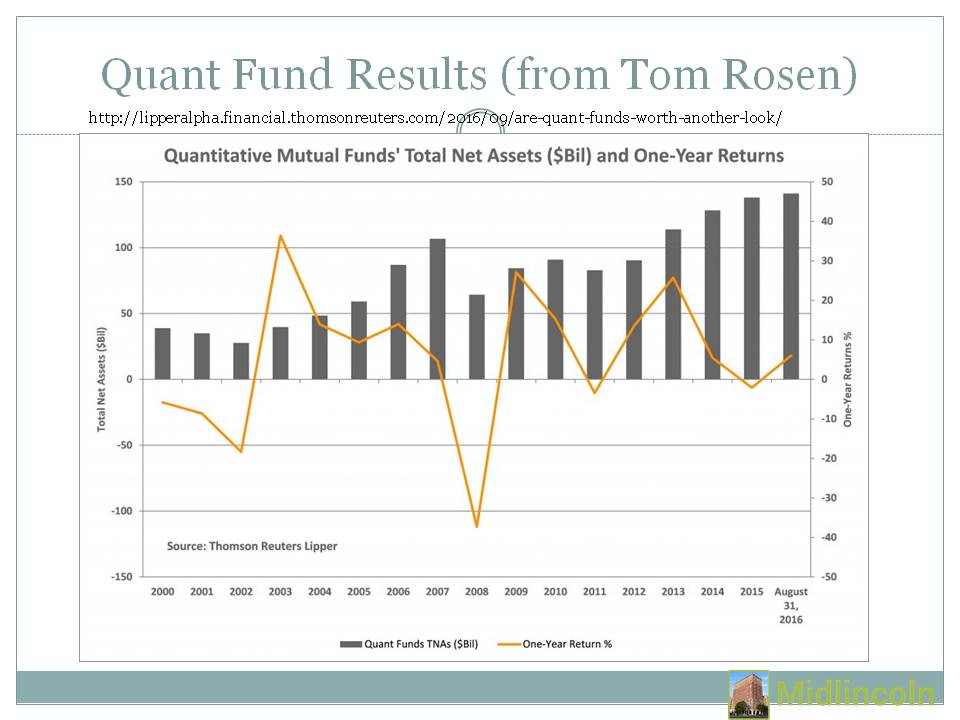
Quant Fund Results (from Tom Rosen)
Download file in Power Point
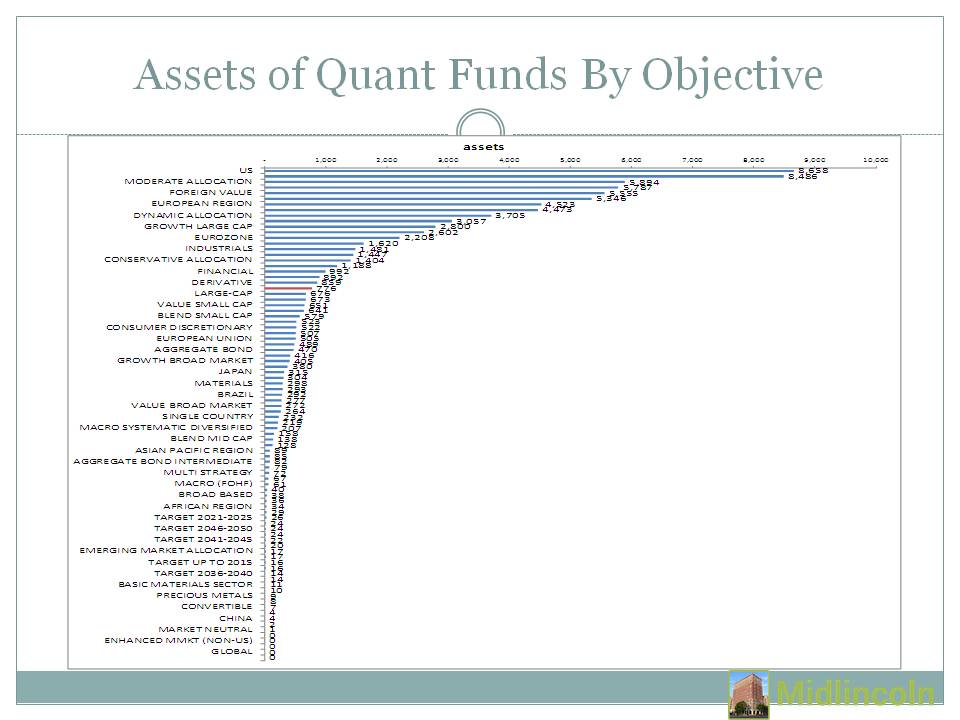
Assets of Quant Funds by Objective
Download file in Power Point
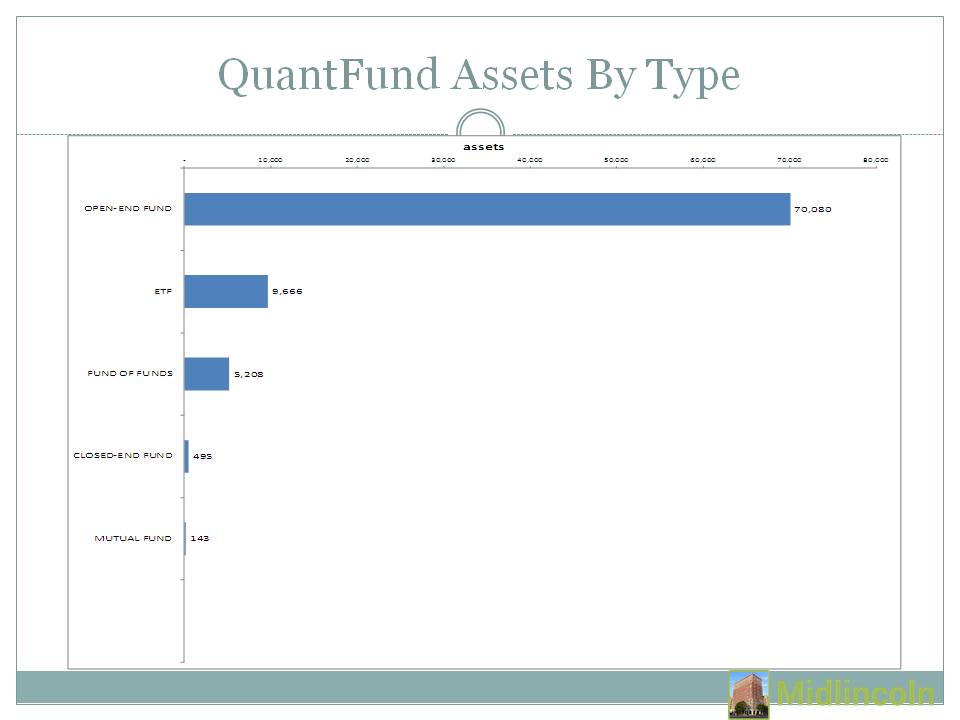
Quant Funds By Type of Fund
Download file in Power Point
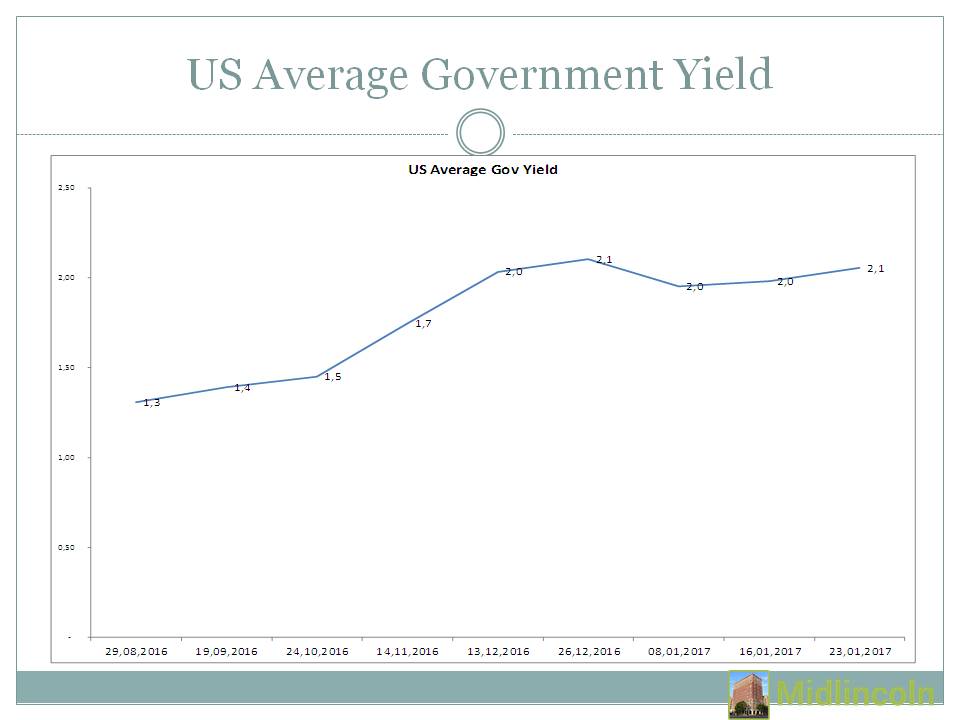
US Govt Bond Yield is a notch higher last week
Download file in Power Point
Cross Country Capex Growth 2017
Download file in Power Point
GEM Total Inflows Last Month
Download file in Power Point
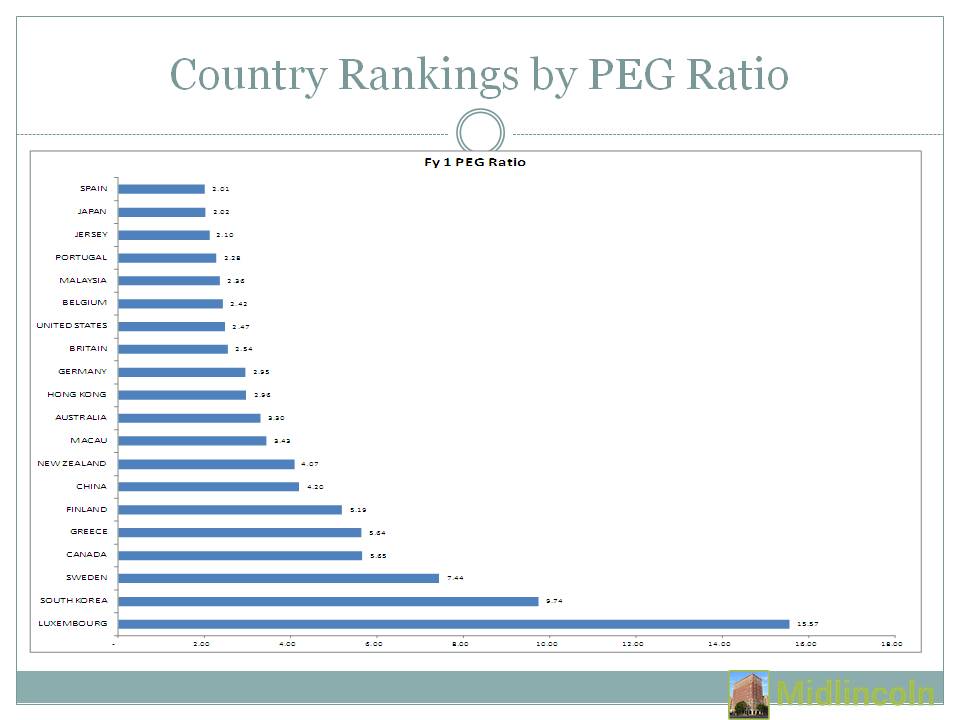
Country Rankings by PEG Metric
Download file in Power Point
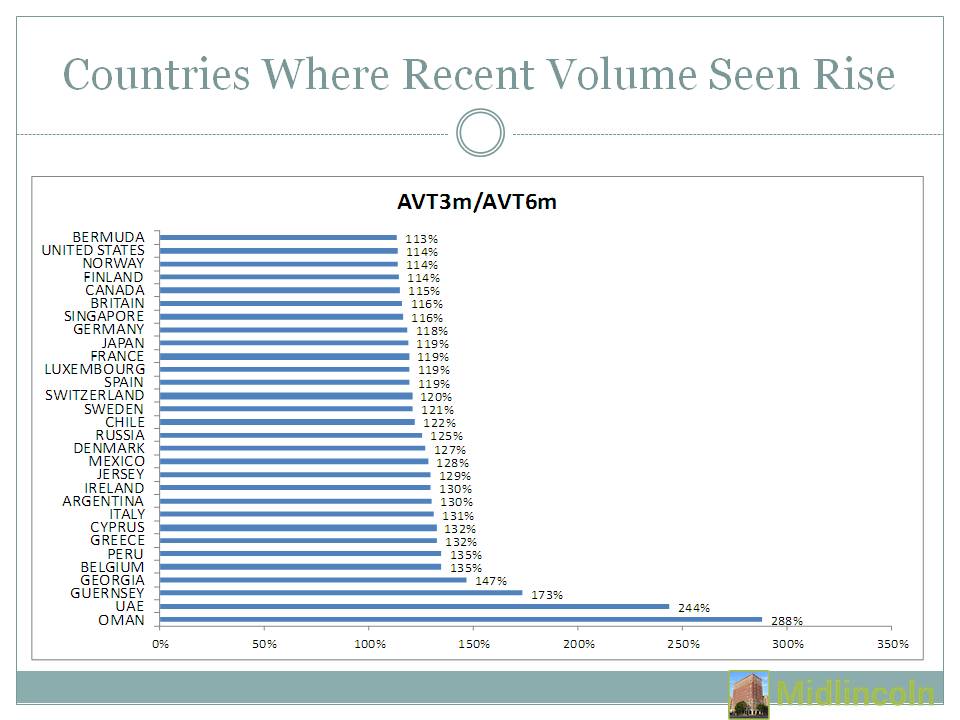
Country where recent trading volume seen biggest pick up
Download file in Power Point
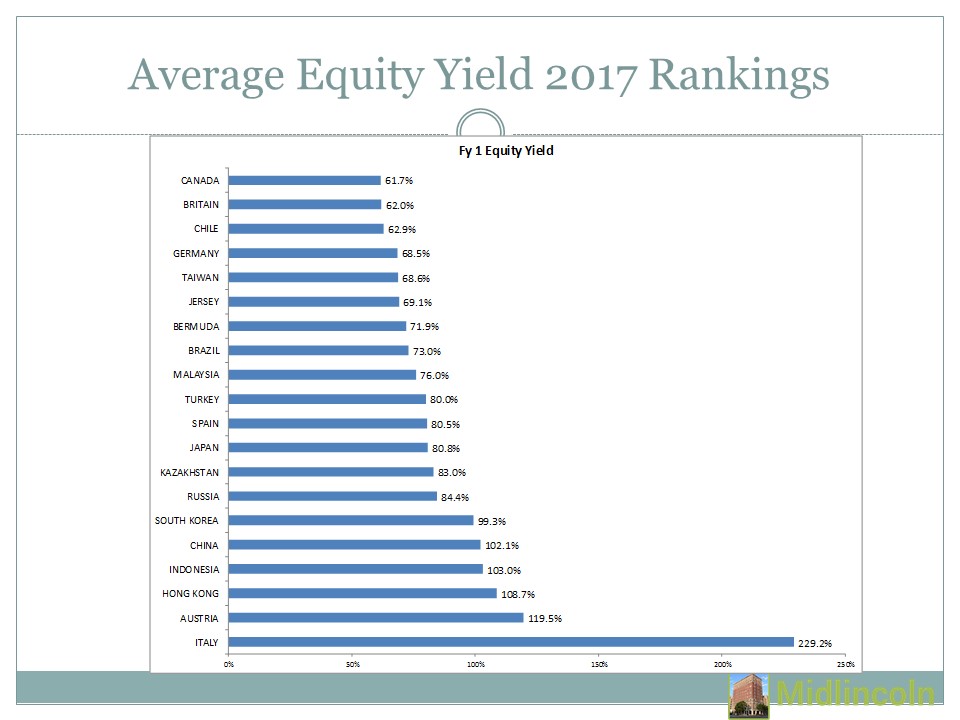
Highest Equity Yield
Download file in Power Point
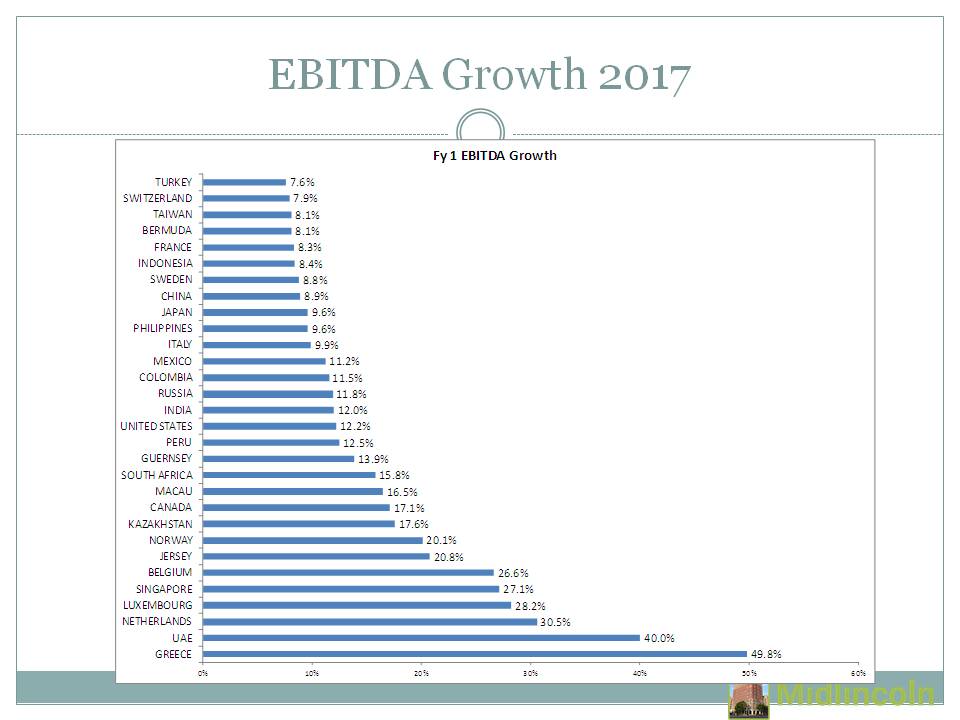
Cross Country Ebitda Growth
Download file in Power Point
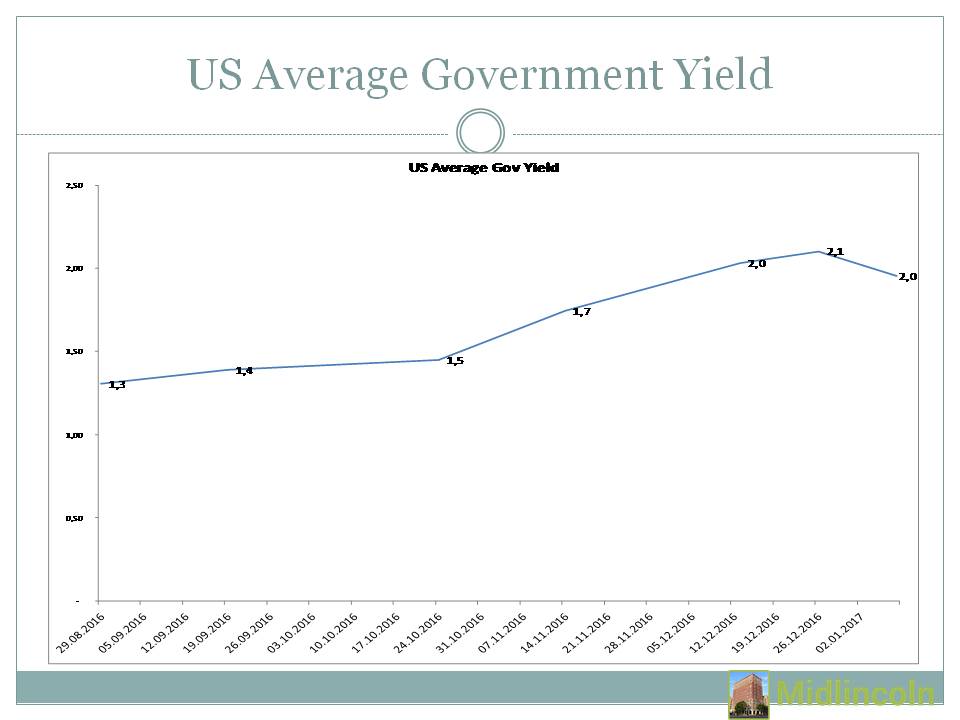
US Average Government Bond Yield Comes Off
Download file in Power Point
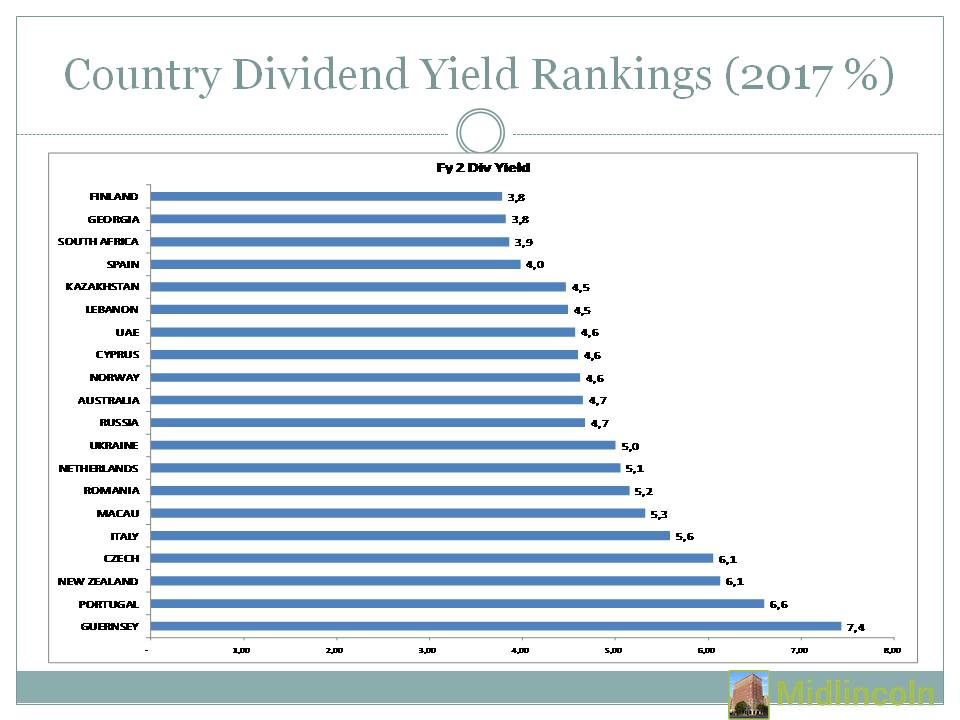
Country Dividend Yield Ranks
Download file in Power Point
Country Dividend Yield Ranks
Download file in Power Point
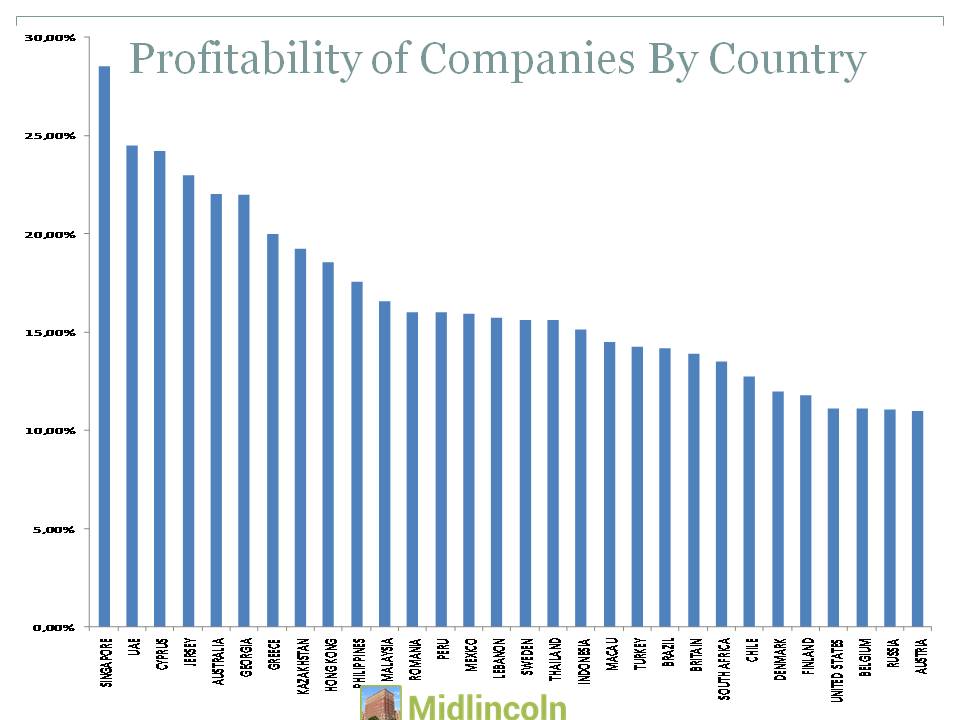
Average Net Margin By Country From Best to Worst
Download file in Power Point
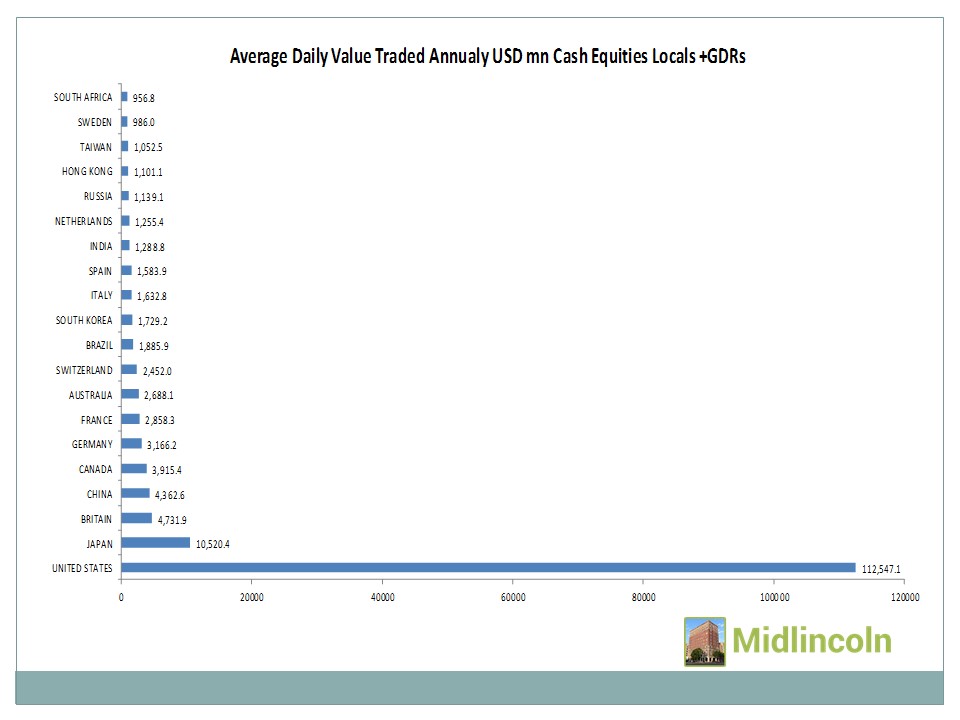
Largest Equity Markets by Liquidity
Download file in Power Point