MidLincoln ML Global Real Estate Index Eq.Weight| basketname | weekch | monthch | ytdch | yearch | | ML Global Real Estate | 0.38 | -0.97 | -19.82 | -23.09 |
Basket 12m Performance Weighted by Various Factors Items| MCap | Sales | netincome | | 0.0 | 0.0 | 0.0 |
| netmargin | DividenYield | 52wkchange | risk | | 0.0 | 0.0 | 160.0 | 0.0 |
Select Equity Indexes Yields| name | weekch | monthch | ytdch | yearch | | MICEX Index | 1.71 | 7.26 | 21.16 | 21.58 | | Russian Trading System Cash Index | 3.16 | 5.90 | 38.88 | 29.44 | | Russian Depositary Index USD | 2.40 | 7.03 | 40.44 | 28.68 | | S&P 500 Index | -0.97 | 3.09 | 6.23 | 4.79 | | Dow Jones Industrial Average | 0.10 | 5.67 | 8.90 | 7.41 | | FTSE 100 Index | -1.61 | -3.21 | 7.28 | 7.89 | | Nikkei 225 | 0.46 | 5.74 | -3.19 | -6.63 | | Hong Kong Hang Seng Index | -1.13 | -2.04 | 2.52 | 0.81 | | Ibovespa Brasil Sao Paulo Stock Exchange Index | -2.02 | -7.10 | 39.14 | 32.97 | | Borsa Istanbul 100 Index | -1.44 | -6.44 | 0.12 | -1.31 | | FTSE/JSE Africa All Share Index | -3.34 | -3.54 | -3.55 | -0.58 | | Warsaw Stock Exchange WIG Total Return Index | -0.22 | -1.22 | 4.32 | 4.16 | | Shanghai Stock Exchange Composite Index | -1.75 | 3.36 | -9.65 | -9.20 | | S&P BSE SENSEX Index | -0.33 | -6.02 | 0.86 | 2.36 | | Korea Stock Exchange KOSPI Index | -0.38 | -1.78 | 0.47 | 0.00 | | Jakarta Stock Exchange Composite Index | 3.28 | -2.85 | 14.76 | 15.93 | | Mexican Stock Exchange Mexican Bolsa IPC Index | -1.77 | -7.19 | 3.59 | 3.63 | | S&P/TSX Composite Index | -0.15 | 1.81 | 14.53 | 12.68 | | Karachi Stock Exchange KSE100 Index | 0.77 | 9.04 | 32.77 | 33.04 | | | | | | | Deutsche Boerse AG German Stock Index DAX | -1.74 | -1.42 | -2.14 | -2.22 |
Best Stocks 1 Week in USD %ch| name | ChngePct | Country | | Bumi Serpong Damai Tbk PT (BSDE:IJ) | 10.87 | | | Etalon Group Ltd (ETLN:LI) | 9.89 | | | Host Hotels & Resorts Inc (HST:US) | 7.66 | | | CBRE Group Inc (CBG:US) | 5.44 | | | Daelim Industrial Co Ltd (000210:KS) | 3.50 | | | SL Green Realty Corp (SLG:US) | 3.18 | | | Vornado Realty Trust (VNO:US) | 2.47 | | | Segro PLC (SGRO:LN) | 2.41 | | | Country Garden Holdings Co Ltd (2007:HK) | 2.37 | | | PIK Group PJSC (PIKK:RM) | 2.35 | |
Worst Stocks 1 week in USD %| name | ChngePct | Country | | Unitech Ltd (UT:IN) | -6.38 | | | Multiplan Empreendimentos Imobiliarios SA (MULT3:BZ) | -4.71 | | | Longfor Properties Co Ltd (960:HK) | -4.54 | | | Emlak Konut Gayrimenkul Yatirim Ortakligi AS (EKGYO:TI) | -4.43 | | | Agile Group Holdings Ltd (3383:HK) | -4.28 | | | American Tower Corp (AMT:US) | -3.84 | | | BR Malls Participacoes SA (BRML3:BZ) | -3.77 | | | Westfield Corp (WFD:AU) | -3.75 | | | Shanghai Industrial Holdings Ltd (363:HK) | -3.33 | | | Ayala Corp (AC:PM) | -3.30 | |
best Stocks 1 month in USD %| name | ChngePct | Country | | Host Hotels & Resorts Inc (HST:US) | 20.51 | | | CBRE Group Inc (CBG:US) | 15.86 | | | Vornado Realty Trust (VNO:US) | 13.75 | | | SL Green Realty Corp (SLG:US) | 12.68 | | | Weyerhaeuser Co (WY:US) | 10.72 | | | Sumitomo Realty & Development Co Ltd (8830:JP) | 9.78 | | | Etalon Group Ltd (ETLN:LI) | 7.14 | | | Boston Properties Inc (BXP:US) | 6.93 | | | Ruentex Development Co Ltd (9945:TT) | 5.46 | | | Country Garden Holdings Co Ltd (2007:HK) | 5.06 | |
Worst Stocks 1 month in USD %| name | ChngePct | Country | | DLF Ltd (DLFU:IN) | -20.25 | | | Unitech Ltd (UT:IN) | -19.10 | | | Emlak Konut Gayrimenkul Yatirim Ortakligi AS (EKGYO:TI) | -16.83 | | | BR Malls Participacoes SA (BRML3:BZ) | -16.80 | | | Ayala Corp (AC:PM) | -16.42 | | | Lippo Karawaci Tbk PT (LPKR:IJ) | -16.03 | | | BR Properties SA (BRPR3:BZ) | -15.42 | | | Multiplan Empreendimentos Imobiliarios SA (MULT3:BZ) | -15.16 | | | Bumi Serpong Damai Tbk PT (BSDE:IJ) | -12.68 | | | New World Development Co Ltd (17:HK) | -11.48 | |
best Stocks ytd in USD %| name | ChngePct | Country | | Multiplan Empreendimentos Imobiliarios SA (MULT3:BZ) | 70.60 | | | Etalon Group Ltd (ETLN:LI) | 67.60 | | | PIK Group PJSC (PIKK:RM) | 47.86 | | | BR Malls Participacoes SA (BRML3:BZ) | 46.13 | | | Country Garden Holdings Co Ltd (2007:HK) | 37.35 | | | Iron Mountain Inc (IRM:US) | 25.77 | | | Liberty Property Trust (LPT:US) | 25.60 | | | Central Pattana PCL (CPN:TB) | 25.15 | | | Daelim Industrial Co Ltd (000210:KS) | 24.57 | | | Duke Realty Corp (DRE:US) | 22.65 | |
Worst Stocks ytd in USD %| name | ChngePct | Country | | British Land Co PLC/The (BLND:LN) | -35.59 | | | Unitech Ltd (UT:IN) | -33.65 | | | Sino-Ocean Group Holding Ltd (3377:HK) | -31.63 | | | Land Securities Group PLC (LAND:LN) | -30.34 | | | Intu Properties PLC (INTU:LN) | -29.21 | | | Shimao Property Holdings Ltd (813:HK) | -25.44 | | | Equity Residential (EQR:US) | -25.13 | | | Lippo Karawaci Tbk PT (LPKR:IJ) | -23.18 | | | China Jinmao Holdings Group Ltd (817:HK) | -23.06 | | | Raven Russia Ltd (RUS:LN) | -18.94 | |
Sector Performance in ML Global Real Estate in USD 1 month % | sector | ChngePct | | Financials | -16.42 | | Industrials | -5.95 | | Real Estate | -1.76 | | Consumer Discretionary | 1.13 |
Sector Performance in ML Global Real Estate in USD YTD % | sector | ChngePct | | Financials | -11.28 | | Real Estate | -1.06 | | Industrials | 15.50 | | Consumer Discretionary | 47.86 |
ML Global Real Estate Stock News
Daelim Industrial Co LtdIneos Styrolution adding specialty capacity in MexicoDaelim Signed an MOU with Iranian Oil Company to Improve ...
China Resources Land LtdBRIEF-China Resources Land updates on land acquisition for ...Goldman Sachs: Buy Chinese stocks with foreign assets as yuan falls
Poly Property Group Co LtdMarina Groenberg Acquires 2500 Shares of Polymetal International ...Polymetal International PLC (POLY) Insider Marina Groenberg ...
Yuexiu Property Co LtdMoody's: Yuexiu Property's moderate 2015 results within expectationsMoody's: Yuexiu Property Company Limited's ratings unaffected by ...
New World Development Co LtdETF Alert: iShares Asia/Pacific Dividend (DVYA) Declines 0.54% for ...Notable ETF Flows Change: WisdomTree International MidCap Div ...
Country Garden Holdings Co Ltd$100 Billion Chinese-Made City Near Singapore 'Scares the Hell ...Chinese-made $100 billion city near Singapore 'scares everybody'
Shui On Land LtdBRIEF-Shui On Land Ltd says Innovate Zone entered into financial ...Country Garden teams up with Shui On Land for upmarket ...
Sino-Ocean Group Holding LtdSino-Ocean Group, KKR to invest in Capital JudaKKR si allea con Sino-Ocean per gli outlet in Cina. Pure Global ...
Agile Group Holdings LtdMoody's changes Agile Group's outlook to stable from negativeBRIEF-Agile Group Holdings says unit to inject funds into JV ...
Shanghai Industrial Holdings LtdHong Kong Stocks Gain on Italy Optimism; Shenzhen Trading SlowsShanghai Composite Index Falls, Despite Positive Services Industry ...
Greentown China Holdings LtdBRIEF-Greentown China Holdings Jan-Oct contracted sales of about ...Moody's assigns definitive Ba3 to Greentown China's USD perpetual ...
SOHO China LtdTech sector boosting property demand in Beijing, Shanghai: Soho ...Moody's downgrades SOHO China's ratings to Ba3; outlook negative
China Overseas Land & Investment LtdHong Kong Stocks Erase Advance as Property Companies DeclineToday's ETF On Watch: WisdomTree Emerging Mkts Qual Div Gr ...
Shimao Property Holdings LtdSogo operator Lifestyle International wins Kai Tak site for HK$7.39bForm NQ FIRST TRUST/ABERDEEN For: Sep 30
China Jinmao Holdings Group LtdIt looks as if 2016 will be a year to forget for Li Ka-shing and CK ...Macquarie Capital partners with Chinese property developer to ...
China Overseas Grand Oceans Group LtdBRIEF-China Overseas Grand Oceans says Oct property contracted ...中国海外宏洋集团估值虽低但并不宜介入
Link REITLink Reit buoyed by Hong Kong property curbHong Kong Legco approves motion to 'counteract' dominance of ...
Mitsui Fudosan Co LtdHoboken's Waterfront Corporate Center III Has a New OwnerSKS Partners Wins Prestigious Platinum LEED Certification
Mitsubishi Estate Co LtdStock Watch: Focusing in on Mitsubishi Estate Co., Ltd. (TSE:8802)Mitsubishi Estate Co Ltd (MITEY) Stock Rating Lowered by Zacks ...
Sumitomo Realty & Development Co LtdREFILE-BRIEF-Sumitomo Realty & Development Co Ltd's revenue ...BRIEF-Sumitomo Realty & Development Co Ltd's revenue is seen ...
Japan Retail Fund Investment CorpJapan Could Cut Tax Revenue Estimate Due to Low Corporate ...USD/JPY – Yen Ticks Higher, Japanese Current Account, GDP Next
Longfor Properties Co LtdThe growing attraction of Chinese real estate investmentsCPP Fund Totals $300.5 Billion at Second Quarter Fiscal 2017
Ruentex Development Co LtdRuen Chen quiet on Nan Shan Life fundingLegislators get new ammunition in OBI Pharma share controversy
Ayala CorpAyala Corp. pushes for manufacturing roadmapAyala Corp. nets nearly P20B
Ayala Land Incまにら新聞ウェブAyala Land to open executive course at Southlinks
American Tower CorpPrice Target Analysis: American Tower Corporation (NYSE:AMT)Levels in Review for American Tower Corporation (NYSE:AMT)
AvalonBay Communities IncLevels in Review for AvalonBay Communities, Inc. (NYSE:AVB)The Two Best REITs To Buy Right Now
British Land Co PLC/TheBritish Land Company PLC 10% Potential Upside Indicated by ...Exane BNP Paribas Issues Price Target With 12.83% Upside On ...
BR Malls Participacoes SANoteworthy Earnings: Analysis and BR Malls Participacoes SA (ADR ...Brazil's BR Malls posts 3rd-qtr net income of 35.5 mln reais
BR Properties SARekonstrukcija crkve na Sv. Stefanu: Falsifikati sa blagoslovomNoteworthy Earnings: Analysis and BR Malls Participacoes SA (ADR ...
Bumi Serpong Damai Tbk PT4 Saham Properti yang Layak Anda KoleksiIHSG Awal Pekan Diprediksi Bakal Bergerak Positif
Boston Properties IncBoston Properties Inc. (BXP) Stake Lowered by Teachers Advisors ...Analyst Targets on Boston Properties, Inc. (NYSE:BXP) Underscore ...
CBRE Group IncCBRE Group, Inc. Earns Top Score on Corporate Equality Index for ...Market Check: Narrowing in on Shares of CBRE Group, Inc. (NYSE ...
Crown Castle International CorpBlackRock Japan Co. Ltd Has $43281000 Stake in Crown Castle ...Looking at the Numbers for Crown Castle International Corp. (NYSE ...
Central Pattana PCLFast conditions, choppy seas, a spirit of competition for day two of ...Phuket King's Cup Regatta 30th Anniversary: the Heritage of Passion
DLF LtdBuy DLF, target Rs 128 : Siddarth BhamreCompetition Comm dismisses complaint against DLF
Digital Realty Trust IncDigital Realty Trust Inc. (DLR) Shares Bought by Swiss National BankLevels in Review for Digital Realty Trust, Inc. (NYSE:DLR)
Duke Realty CorpStock Intraday Alert - Duke Realty Corporation's (DRE)Duke Realty Expands Northeast Team with New VP
Dexus Property GroupKeeping an Eye on Shares of Dexus Property Group (ASX:DXS)DEXUS Property Group gains 49pc with $332m Sydney Metro sale
Emlak Konut Gayrimenkul Yatirim Ortakligi ASKAP: EKGYO [ ] EMLAK KONUT GAYRIMENKUL YATIRIM ...***EKGYO*** EMLAK KONUT GAYRİMENKUL YATIRIM ORTAKLIĞI ...
Equity ResidentialEarnings Reaction History: Equity Residential (NYSE:EQR) has a ...Analyst Recommendation Is A Thing Worth Watching: Equity ...
Essex Property Trust IncEssex Property Trust Inc. (ESS) Stake Boosted by National Pension ...Analyst Targets on Essex Property Trust, Inc. (NYSE:ESS ...
Etalon Group LtdInequality Is Key to Making Sense of Russian Consumer PlightEtalon Bets Russian Homebuyers to Persevere Amid Crisis
Federal Realty Investment TrustRating Sentiment Report: Is there a Bearish outlook for Federal ...Stock in Focus: Federal Realty Investment Trust (NYSE:FRT)
General Growth Properties IncHot Stock - General Growth Properties, Inc's (GGP)Analysts Upside For This Dividend Diamond: General Growth ...
Goodman GroupChecking the Numbers on Goodman Group (ASX:GMG)US equity firms move in on Goodman business parks
GPT Group/TheThe Australian Financial Review's Rob Harley: Lessons from a life in ...The upside, and downside, to Bob Johnston's GPT Group
Growthpoint Properties LtdGlobalworth Real Estate Investments: Capital Increase Marks A StepGrowthpoint Properties a preluat 26,9% din acțiunile de la ...
Welltower IncWelltower Inc. (HCN) Shares Bought by WINTON GROUP LtdWelltower Is 'Taking Charge'
HCP IncHow Risky Is HCP, Inc.?HCP Inc. (HCP) Shares Sold by Neuberger Berman Group LLC
Host Hotels & Resorts IncAnalyst Research Summary: Host Hotels & Resorts, Inc. (NYSE:HST)Analyst Opinions To Note: Host Hotels & Resorts, Inc. (NYSE:HST ...
IMMOFINANZ AGConsiliul Concurenței a autorizat tranzacția prin care Immofinanz ...Competition body authorizes take over by Immofinanz AG of office ...
Intu Properties PLCMarket Risers: Frenkel Topping Group Plc, HSBC Holdings plc, Intu ...BNP Paribas Reaffirms Underperform Rating for Intu Properties PLC ...
Iron Mountain IncIron Mountain: Worth A Look From Income InvestorsInsider Selling: Iron Mountain Inc. (IRM) Director Sells 954 Shares of ...
Kimco Realty CorpSEC Filing: Real Estate Management Services LLC Has Lowered Its ...Stock in Focus: Kimco Realty Corporation (NYSE:KIM)
Land Securities Group PLCMarket Risers: Land Securities Group plc, National Grid plc ...Land Securities Group plc 7.3% Potential Upside Indicated by ...
KlepierrePlaza agrees settlement with KlepierreCorrectie: Beursblik: Barclays verhoogt advies Klepierre
Lippo Karawaci Tbk PTJual mall di Bali, Lippo Karawaci dapat dana segar Rp 800 miliarIndonesia: LMIR Trust to acquire Lippo Mall Kuta for $59.8m
Liberty Property TrustLiberty Property Trust Commences Development of “The Camden ...Liberty Property Trust (NYSE:LPT) lost about -4.3 percent in value ...
Macerich Co/TheOwnership Action To Observe: Macerich Co (NYSE:MAC ...La Francaise Forum Securities Ltd Lowers stake in Macerich Co ...
Mirvac GroupWatching the Levels for Mirvac Group (ASX:MGR)Mirvac's residential chief heads to Dubai
Multiplan Empreendimentos Imobiliarios SAIbovespa Surges With Oil as Budget Deal Adds to Fiscal OptimismMultiplan compra fatia adicional de 4,5% no Barra Shopping, no Rio
Realty Income CorpRealty Income Corp. (O) Downgraded by Bank of America Corp. to ...Institutional Move: Realty Income Corp (O) Shareholder Farmers ...
PIK Group PJSCBlackstone mulls sale of 137M sf European warehouse portfolioПрибыль ГК «ПИК» за I полугодие 2016 г. упала почти в 2,5 раза ...
Prologis IncPrologis Inc. (PLD) Stake Raised by Rhumbline AdvisersEarnings Preview: Prologis, Inc. (NYSE:PLD) moved up 14 times out ...
Public StorageComing to new mixed-use development: More self-storageConsumer warning: What you should know before you use self ...
Regency Centers CorpPrudential Financial Inc. Has $46299000 Stake in Regency Centers ...Analysts Upside For This Dividend Diamond: Regency Centers ...
Raven Russia LtdIs RAVEN RUSSIA LTD 6.5% RED CNV PREF SHS NPV a Buy ...Raven Russia reports strong balance sheet as market stabilises
Scentre GroupVolatility Watch on Shares of Scentre Group (ASX:SCG)Scentre Group expands outdoor network to non-Westfield malls in ...
StocklandStockland's Mark Steinert deals property group back into apartmentsRobots to make shopping easier
Segro PLCThe SEGRO plc (SGRO) Rating Decreased to Neutral at Goldman ...Checking the Metrics on Shares of SEGRO plc (LSE:SGRO)
SL Green Realty CorpNotable Analyst Research Reports: Amphenol Corporation (NYSE ...What do Analysts Say about: SL Green Realty Corp. (NYSE:SLG)
SM Prime Holdings Incまにら新聞ウェブSM to open biggest mall in China in December
Simon Property Group IncTIAA CREF Investment Management LLC Has $356460000 Stake in ...Simon Property Group Fights to Reinvent the Shopping Mall
UDR IncUDR, Inc. (UDR) Appoints New CFOUDR, Inc. (NYSE:UDR) topped earnings-per-share estimates 33% of ...
UEM Sunrise BhdBRIEF-Uem Sunrise Bhd says qtrly revenue 421.3 million rgt versus ...UEM Sunrise units served with C$15.14m claims
Unitech LtdSupreme Court Stays Unitech Homebuyers Meetings On ...SC directs Unitech to refund money to home buyers for delay in ...
VEREIT IncVereit Inc. (VER) Downgraded to "Underperform" at Bank of America ...Financial Stocks Worth Chasing: SLM Corporation (SLM), VEREIT ...
Vornado Realty TrustBlackRock Fund Advisors Has $551404000 Position in Vornado ...Stock in Focus: Vornado Realty Trust (NYSE:VNO)
Ventas IncVentas Inc. (VTR) Shares Sold by Teachers Advisors LLCAnalysts Set Ventas Inc. (VTR) Price Target at $63.22
Westfield CorpKeeping an Eye on Shares of Westfield Corp. (ASX:WFD)Better buy? Westfield Corp Ltd vs Scentre Group
Weyerhaeuser CoWeyerhaeuser Co Unusual Bearish Options Activity Means Higher ...MAI Capital Management Boosts Stake in Weyerhaeuser Co (WY)
ML Global Real Estate
By: Research Team 
DescriptionMidLincoln Global Real Estate Index Is an equity index consisting of emerging and developed market real estate stocks and select REITs. The index is calculated with equal weights set for each stock. Comment
Best last week among stocks was Bumi Serpong Damai Tbk PT (BSDE:IJ) +10.87%, Etalon Group Ltd (ETLN:LI) +9.89%, Host Hotels & Resorts Inc (HST:US) +7.66%,
While worst last week among stocks was Unitech Ltd (UT:IN) -6.38%, Multiplan Empreendimentos Imobiliarios SA (MULT3:BZ) -4.71%, Longfor Properties Co Ltd (960:HK) -4.54%,
Best last month among stocks was Host Hotels & Resorts Inc (HST:US) +20.51%, CBRE Group Inc (CBG:US) +15.86%, Vornado Realty Trust (VNO:US) +13.75%,
While worst last month among stocks was DLF Ltd (DLFU:IN) -20.25%, Unitech Ltd (UT:IN) -19.10%, Emlak Konut Gayrimenkul Yatirim Ortakligi AS (EKGYO:TI) -16.83%,
Best YTD among stocks was Multiplan Empreendimentos Imobiliarios SA (MULT3:BZ) +70.60%, Etalon Group Ltd (ETLN:LI) +67.60%, PIK Group PJSC (PIKK:RM) +47.86%,
While worst YTD among stocks was British Land Co PLC/The (BLND:LN) -35.59%, Unitech Ltd (UT:IN) -33.65%, Sino-Ocean Group Holding Ltd (3377:HK) -31.63%,
Companies Reported last month include: | Ticker | Reported | | 8801:JP | 11/11/2016 | | 8802:JP | 11/7/2016 | | 8830:JP | 11/14/2016 | | 9945:TT | 11/14/2016 | | AC:PM | 11/14/2016 | | ALI:PM | 11/9/2016 | | AMT:US | 10/27/2016 | | BLND:LN | 11/16/2016 | | BRML3:BZ | 11/14/2016 | | BRPR3:BZ | 11/9/2016 | | BSDE:IJ | 10/27/2016 | | CBG:US | 10/27/2016 | | CPN:TB | 11/8/2016 | | DLR:US | 10/27/2016 | | EKGYO:TI | 10/31/2016 | | ESS:US | 10/27/2016 | | FRT:US | 11/2/2016 | | GGP:US | 10/31/2016 | | HCN:US | 11/2/2016 | | HCP:US | 11/1/2016 | | HST:US | 11/2/2016 | | IRM:US | 11/1/2016 | | KIM:US | 10/27/2016 | | LAND:LN | 11/15/2016 | | LPKR:IJ | 11/11/2016 | | MAC:US | 10/27/2016 | | MULT3:BZ | 10/31/2016 | | REG:US | 11/1/2016 | | SMPH:PM | 11/8/2016 | | VER:US | 11/2/2016 | | VNO:US | 10/31/2016 | | VTR:US | 10/28/2016 | | WY:US | 10/28/2016 |
Companies that will report next month include: | Ticker | Reporting | | 000210:KS | 1/26/2017 | | CCI:US | 1/25/2017 | | DLFU:IN | 12/2/2016 | | DRE:US | 1/29/2017 | | EQR:US | 1/31/2017 | | IIA:AV | 12/19/2016 | | PLD:US | 1/26/2017 | | SLG:US | 1/29/2017 | | SPG:US | 1/31/2017 | | UEMS:MK | 12/2/2016 | | UT:IN | 11/29/2016 |
Ex Div Stocks Last Month: | Ticker | ExDv | | 17:HK | 11/24/2016 | | 3900:HK | 3/1/2017 | | 823:HK | 11/22/2016 | | 8801:JP | 3/29/2017 | | 8802:JP | 3/29/2017 | | 8830:JP | 3/29/2017 | | 8953:JP | 2/24/2017 | | AVB:US | 12/28/2016 | | BLND:LN | 1/5/2017 | | CCI:US | 12/14/2016 | | DLR:US | 12/13/2016 | | DRE:US | 11/14/2016 | | ETLN:LI | 11/23/2016 | | FRT:US | 12/29/2016 | | GGP:US | 12/13/2016 | | HCN:US | 11/4/2016 | | HCP:US | 11/8/2016 | | IRM:US | 12/13/2016 | | KIM:US | 12/29/2016 | | LAND:LN | 12/1/2016 | | MAC:US | 11/8/2016 | | O:US | 11/29/2016 | | PSA:US | 12/12/2016 | | REG:US | 11/14/2016 | | SPG:US | 11/14/2016 | | VER:US | 12/28/2016 | | VNO:US | 11/3/2016 |
Companies that will go ex-Div next month include: | Ticker | Reporting | | 000210:KS | 12/28/2016 | | AC:PM | 12/12/2016 | | AMT:US | 12/14/2016 | | BXP:US | 12/28/2016 | | DXS:AU | 12/29/2016 | | EQR:US | 12/23/2016 | | ESS:US | 12/29/2016 | | GMG:AU | 12/23/2016 | | GPT:AU | 12/29/2016 | | HST:US | 12/28/2016 | | LPT:US | 12/29/2016 | | MGR:AU | 12/23/2016 | | O:US | 12/29/2016 | | PLD:US | 12/12/2016 | | SGP:AU | 12/28/2016 | | SLG:US | 12/30/2016 | | UDR:US | 1/5/2017 | | VNO:US | 1/26/2017 | | VTR:US | 12/15/2016 |
Chart: Canadian Real Estate Firms Able To Grow Dividends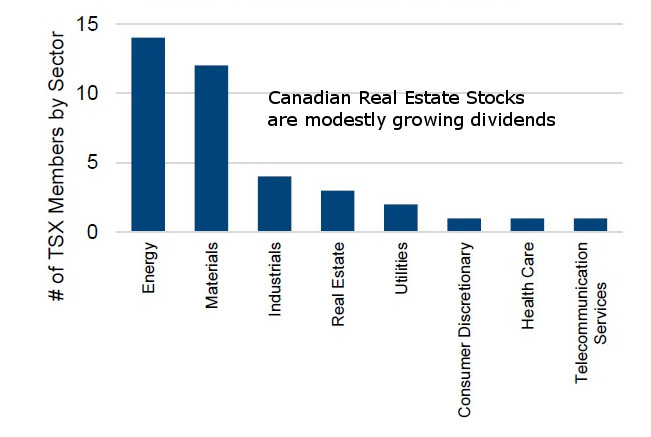 Source: ML, ValueWalk Chart: Colony Capital Inc. Chairman raised a red flag on U.S. real estate saying that the market is 'bubblicious'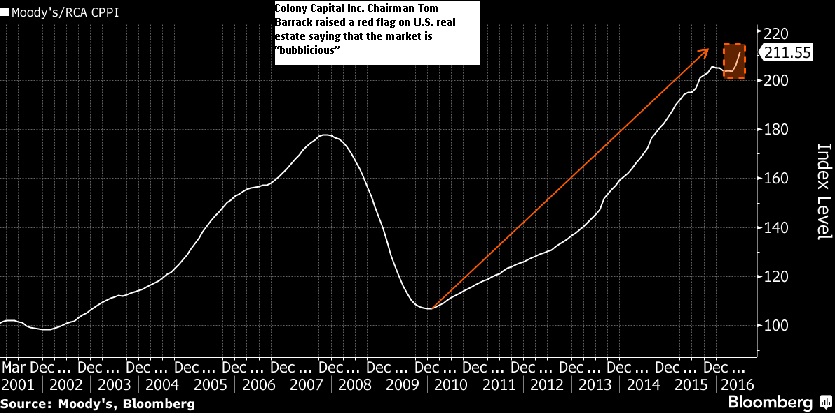 Source: Bloomberg, Moodys Chart: Most Expensive Markets, Top Increases and Top DecreasesGlobally, prime office occupancy costs increased 2.4% in the year ending Q1 2016
- Occupancy costs in EMEA increased by 2.1% year-over-year
- Hong Kong (Central) climbed to the top of CBRE's semi-annual ranking of the world's most expensive office markets
- London-Central (West End), now ranked in second place
- Globally, prime office occupancy costs increased 2.4% in the year ending Q1 2016
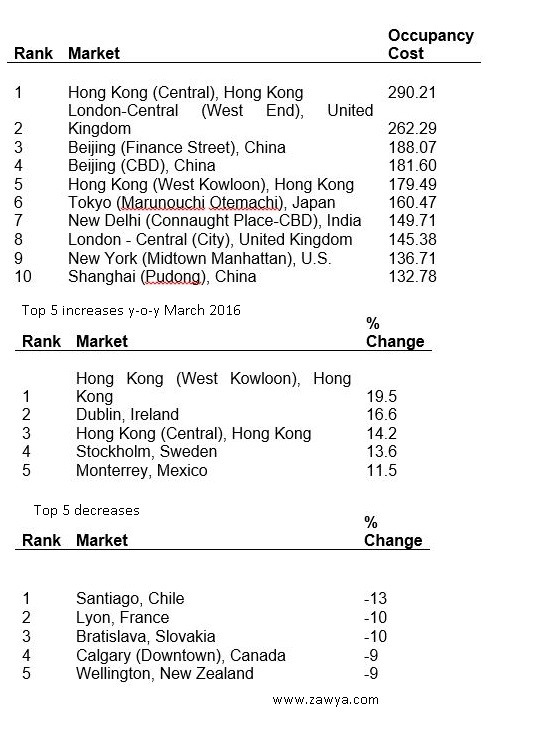 Source: http://www.zawya.com/ Chart: Global Ofice YieldsGlobal Ofice Yields  Source: ML Chart: Net ajusted disposable income per houshold for various countriesUseful to compare to retail penetration 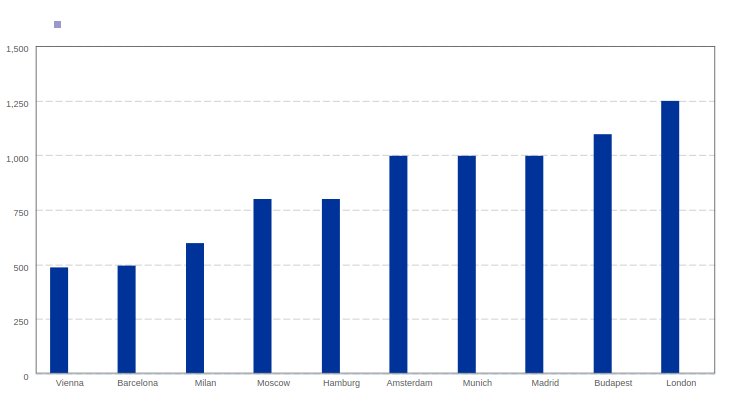 Source: ML Chart: Food retail penetration for various countries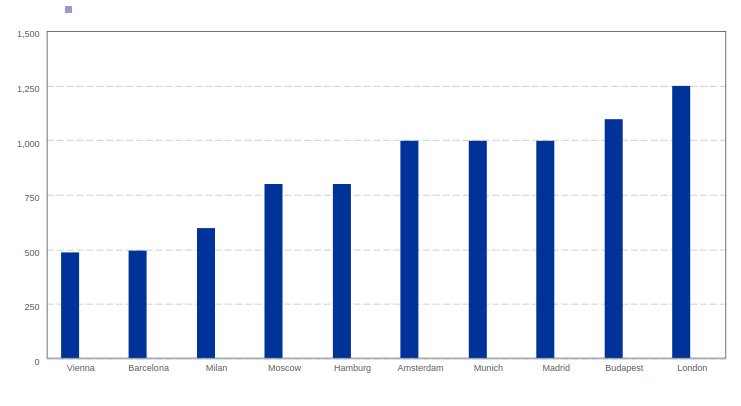 Source: ML Chart: Current Retail Yields are soft compared to their historical averages for Moscow assets 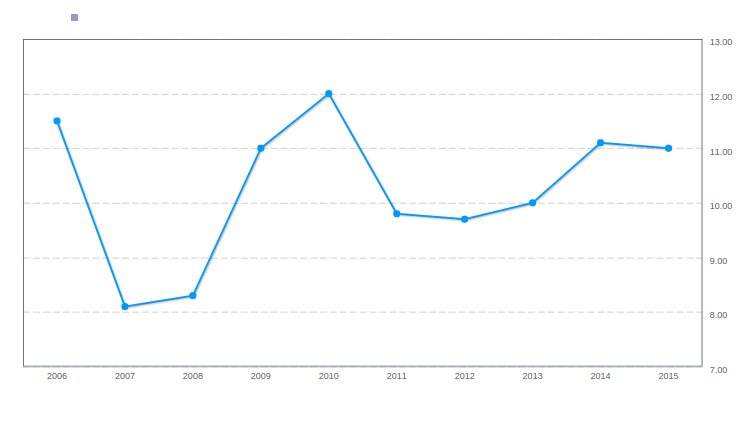 Source: ML Chart: Retail stock per 1000 persons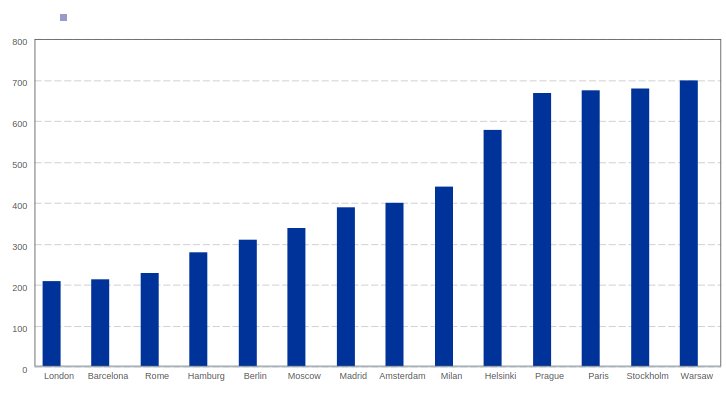 Source: ML Chart: Moscow Warehousing Yields are soft compared to their historical averages for Moscow assets  Source: ML Chart: Average warehousing stock per 1000 persons for select countries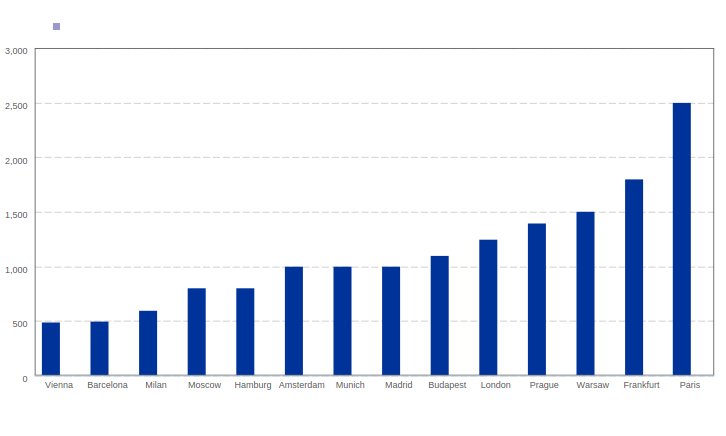 Source: ML
Real Estate Flows, Yields and News Real estate sector has sunk since its creation, and could spiral furtherRising Rates Threaten Global Property Investments3 quick takeaways for residential real estate investorsOpinion: 10 REITs that look like big winners for 2017A-REIT prices open real estate opportunities
Logistic Real Estate Yields Real estate investment trust acquires Bradford logistics warehouse ...Managers feel logistics assets will remain safeGIC continues to tap into booming logistics sector with European dealSingapore: GIC acquires P3 for €2.4b from TPG Real Estate ...GUEST ARTICLE: Family Offices' Craving For Yield Puts European ...
Warehouse Real Estate Yields Pure Industrial Real Estate Trust (AAR.UN) Given Average ...Tough auction tactic, $20000 bids, don't deter keen buyerSTAG Industrial: Why You Should Consider This Monthly-Paying 6 ...5 questions for investors when looking at industrial real estateChinese investors interested in PH property market
Moscow Warehouse Real Estate AP News in Brief at 11:04 pm ESTMoscow Warehouse Fire Kills 17 Migrant WorkersDeadly warehouse fire: Operator accused of ignoring safetyMilkiland hopes to restructure $58.6 mln debt to syndicate in 2016 ...Moscow's industrial heritage 'at risk' in rush to redevelop old Soviet ...
Retail Real Estate Yields National Retail Properties' Series D Preferred Stock Shares Cross ...Foreign investors still dominating Irish real estate marketFitch Rates National Retail Properties' Unsecured Bonds due 2026 ...On safari: South Africa hunts deals in CEE and SEEDemonetisation: REIT listing turns attractive with falling bond yields ...
Bigbox retail Real Estate Yields How To Profit From The Death Of Malls In America4 dividend stocks to put on your 2017 shopping listCreative Real Estate OptionsOur High Yield REIT Portfolio Seeking Maximum Total Returns3 Overlooked Retail Plays For Big Dividends
Moscow Retail Real Estate Moscow luxury flat prices fall 14% in last yearInvestments in Russia's commercial real estate grow by 30%Putin Is Becoming Russia's Biggest Mortgage BrokerLenta announces the completion of purchase of Kesko food retail ...The US president as an enterprise
Office Real Estate Yields GUEST ARTICLE: Family Offices' Craving For Yield Puts European ...Demonetisation: REIT listing turns attractive with falling bond yields ...Blackstone Plans India's First REITCromwell Considers Singapore IPO of European PropertiesIs This High-Dividend Stock Yielding 5.6%+ safe?
Residential Real Estate Yields Real estate sector has sunk since its creation, and could spiral further3 quick takeaways for residential real estate investorsAlexandria Real Estate (ARE) Raises Quarterly Dividend 3.7% to ...GUEST ARTICLE: Family Offices' Craving For Yield Puts European ...Opinion: 10 REITs that look like big winners for 2017Country Composition| Country | Weight % | | UNITED STATES | 35.37 | | HONG KONG | 12.20 | | CHINA | 8.54 | | AUSTRALIA | 8.54 | | JAPAN | 4.88 | | BRITAIN | 4.88 | | BRAZIL | 3.66 | | PHILIPPINES | 3.66 | | RUSSIA | 2.44 | | INDIA | 2.44 | | INDONESIA | 2.44 | | THAILAND | 1.22 | | SOUTH AFRICA | 1.22 | | SOUTH KOREA | 1.22 | | TAIWAN | 1.22 | | FRANCE | 1.22 | | TURKEY | 1.22 | | AUSTRIA | 1.22 | | MALAYSIA | 1.22 | | GUERNSEY | 1.22 |
Loading graph...
/Sector Composition| Country | Weight % | | UNITED STATES | 35.37 | | HONG KONG | 12.20 | | CHINA | 8.54 | | AUSTRALIA | 8.54 | | JAPAN | 4.88 | | BRITAIN | 4.88 | | BRAZIL | 3.66 | | PHILIPPINES | 3.66 | | RUSSIA | 2.44 | | INDIA | 2.44 | | INDONESIA | 2.44 | | THAILAND | 1.22 | | SOUTH AFRICA | 1.22 | | SOUTH KOREA | 1.22 | | TAIWAN | 1.22 | | FRANCE | 1.22 | | TURKEY | 1.22 | | AUSTRIA | 1.22 | | MALAYSIA | 1.22 | | GUERNSEY | 1.22 |
Loading graph...
Key Basket Multiples| Stocks | Total MCap US mn | Payout Ratio | Div Yield | PE | NetMargin | 1yr Return | | 82 | 898755.3 | 57.4 | 3.9 | 26.43 | 30.56 | 0.0 |
Basket Valuations| value | MCap US mn | DividendYield | PE | PS | NetMarginPct | PayoutRatio | 52wkchange | Score | | Dexus Property Group | 6425.19 | 5.02 | 15.71 | 11.39 | 72.50 | 78.86 | 0.27 | 120.28 | | Mirvac Group | 5638.89 | 5.02 | 14.34 | 9.56 | 66.67 | 71.99 | 0.16 | 108.82 | | Stockland | 7624.09 | 6.00 | 14.00 | 4.29 | 30.64 | 84.00 | 0.16 | 85.15 | | Goodman Group | 8753.13 | 3.87 | 15.43 | 10.36 | 67.14 | 59.71 | 0.15 | 95.93 | | Scentre Group | 16483.00 | 5.08 | 18.29 | 9.87 | 53.96 | 92.91 | 0.11 | 113.05 | | GPT Group/The | 6300.27 | 4.98 | 16.11 | 12.62 | 78.34 | 80.23 | 0.08 | 126.88 | | Westfield Corp | 14162.66 | 3.65 | 20.28 | 14.94 | 73.67 | 74.02 | -0.01 | 111.75 | | IMMOFINANZ AG | 2027.80 | 3.47 | 31.65 | 6.30 | 19.91 | 109.83 | -0.14 | 82.29 | | Multiplan Empreendimentos Imobiliarios SA | 3175.04 | 1.69 | 27.91 | 9.42 | 33.75 | 47.17 | 0.44 | 37.80 | | BR Malls Participacoes SA | 1901.91 | 1.92 | 18.08 | 4.82 | 26.66 | 34.71 | 0.15 | 27.79 | | BR Properties SA | 671.95 | 0.78 | 27.54 | 4.61 | 16.74 | 21.48 | -0.02 | -4.99 | | Segro PLC | 4258.56 | 3.91 | 21.56 | 11.33 | 52.55 | 84.30 | -0.19 | 99.45 | | Intu Properties PLC | 4512.36 | 5.16 | 18.30 | 6.28 | 34.32 | 94.43 | -0.29 | 94.51 | | Land Securities Group PLC | 9564.43 | 3.75 | 21.15 | 13.10 | 61.94 | 79.31 | -0.33 | 104.12 | | British Land Co PLC/The | 7598.48 | 4.95 | 16.41 | 9.31 | 56.73 | 81.23 | -0.39 | 105.51 | | Country Garden Holdings Co Ltd | 11754.76 | 3.87 | 8.12 | 0.63 | 7.76 | 31.42 | 0.48 | 15.89 | | SOHO China Ltd | 2755.36 | 6.80 | 51.59 | 11.86 | 22.99 | 350.81 | 0.47 | 307.03 | | Agile Group Holdings Ltd | 2171.70 | 5.51 | 5.77 | 0.33 | 5.72 | 31.79 | 0.10 | 16.19 | | Longfor Properties Co Ltd | 7787.61 | 4.38 | 6.66 | 0.97 | 14.56 | 29.17 | -0.02 | 21.41 | | Greentown China Holdings Ltd | 1818.47 | 2.48 | 6.69 | 0.46 | 6.88 | 16.59 | -0.17 | 0.96 | | Shui On Land Ltd | 1893.93 | 2.70 | 7.35 | 0.93 | 12.65 | 19.85 | -0.18 | 9.32 | | Sino-Ocean Group Holding Ltd | 3284.30 | 5.00 | 6.93 | 0.68 | 9.81 | 34.65 | -0.22 | 21.66 | | Klepierre | 11776.45 | 5.04 | 15.54 | 9.22 | 59.33 | 78.32 | -0.12 | 106.34 | | Raven Russia Ltd | 320.35 | 7.51 | 7.16 | 1.58 | 22.07 | 53.77 | -0.26 | 52.77 | | New World Development Co Ltd | 10368.72 | 5.12 | 11.52 | 1.30 | 11.28 | 58.98 | 0.15 | 43.25 | | Link REIT | 15018.12 | 4.24 | 23.51 | 12.38 | 52.66 | 99.68 | 0.15 | 113.33 | | Shanghai Industrial Holdings Ltd | 3131.17 | 3.86 | 9.39 | 1.18 | 12.57 | 36.25 | 0.13 | 23.90 | | Poly Property Group Co Ltd | 1180.26 | 0.40 | - | 0.33 | 0.00 | -0.00 | 0.00 | -15.65 | | China Overseas Grand Oceans Group Ltd | 835.72 | 0.92 | 5.66 | 0.34 | 6.01 | 5.21 | 0.00 | -10.10 | | China Resources Land Ltd | 16979.49 | 3.49 | 7.81 | 1.13 | 14.47 | 27.26 | -0.10 | 18.17 | | China Jinmao Holdings Group Ltd | 2875.83 | 4.74 | 6.55 | 0.67 | 10.23 | 31.05 | -0.12 | 18.96 | | Yuexiu Property Co Ltd | 1774.88 | 4.14 | 8.91 | 0.55 | 6.17 | 36.89 | -0.13 | 18.37 | | China Overseas Land & Investment Ltd | 31361.15 | 3.45 | 6.81 | 1.33 | 19.53 | 23.49 | -0.13 | 20.44 | | Shimao Property Holdings Ltd | 4523.25 | 6.50 | 4.87 | 0.50 | 10.27 | 31.66 | -0.18 | 21.22 | | DLF Ltd | 2920.26 | 1.95 | 28.91 | 2.29 | 7.92 | 56.37 | 0.03 | 19.77 | | Unitech Ltd | 186.82 | - | - | - | 0.00 | 0.00 | -0.33 | -15.98 | | Bumi Serpong Damai Tbk PT | 2451.13 | 0.85 | 15.38 | 5.12 | 33.29 | 13.07 | 0.03 | 15.36 | | Lippo Karawaci Tbk PT | 1337.47 | 1.31 | 14.76 | 1.65 | 11.18 | 19.34 | -0.38 | -0.27 | | Japan Retail Fund Investment Corp | 5047.61 | 3.80 | - | - | 0.00 | -0.00 | 0.06 | -15.59 | | Mitsui Fudosan Co Ltd | 23584.09 | 1.20 | 20.73 | 1.54 | 7.43 | 24.88 | -0.06 | -4.13 | | Mitsubishi Estate Co Ltd | 27504.30 | 0.75 | 33.77 | 2.79 | 8.26 | 25.33 | -0.07 | -15.90 | | Sumitomo Realty & Development Co Ltd | 13030.78 | 0.75 | 14.82 | 1.67 | 11.27 | 11.12 | -0.11 | -8.20 | | UEM Sunrise Bhd | 1067.73 | 1.52 | 25.61 | 2.76 | 10.78 | 38.93 | -0.18 | 8.26 | | SM Prime Holdings Inc | 15548.57 | 1.04 | 31.33 | 9.62 | 30.71 | 32.58 | 0.17 | 16.48 | | Ayala Corp | 9053.60 | 0.78 | 19.08 | 2.25 | 11.79 | 14.88 | -0.08 | -8.13 | | Ayala Land Inc | 9543.92 | 1.43 | 23.31 | 4.20 | 18.02 | 33.33 | -0.12 | 12.27 | | Etalon Group Ltd | 803.36 | 4.46 | 8.69 | 1.07 | 12.31 | 38.76 | 0.54 | 27.27 | | PIK Group PJSC | 2835.52 | 1.49 | 20.37 | 3.04 | 14.92 | 30.35 | 0.27 | 9.53 | | Growthpoint Properties Ltd | 4943.25 | 7.90 | 14.31 | 7.73 | 54.02 | 113.05 | 0.08 | 137.19 | | Daelim Industrial Co Ltd | 2284.16 | 0.39 | 8.15 | 0.26 | 3.19 | 3.18 | 0.04 | -17.39 | | Ruentex Development Co Ltd | 1665.12 | 6.52 | 8.20 | 4.44 | 54.15 | 53.46 | -0.10 | 83.66 | | Central Pattana PCL | 6960.34 | 1.47 | 26.96 | 8.84 | 32.79 | 39.63 | 0.21 | 30.02 | | Emlak Konut Gayrimenkul Yatirim Ortakligi AS | 3166.02 | 5.19 | 6.74 | 3.35 | 49.70 | 34.98 | -0.14 | 62.15 | | Digital Realty Trust Inc | 14620.66 | 3.89 | 45.02 | 6.89 | 15.30 | 175.13 | 0.31 | 130.07 | | Duke Realty Corp | 8823.00 | 2.93 | 30.52 | 10.36 | 33.94 | 89.42 | 0.27 | 77.47 | | Iron Mountain Inc | 8851.85 | 5.75 | 34.06 | 2.67 | 7.84 | 195.85 | 0.25 | 154.22 | | Liberty Property Trust | 5691.59 | 4.93 | 20.60 | 7.62 | 36.99 | 101.56 | 0.21 | 102.51 | | Ventas Inc | 21285.53 | 4.91 | 35.68 | 6.27 | 17.57 | 175.19 | 0.19 | 141.62 | | Prologis Inc | 26122.77 | 3.38 | 27.26 | 11.61 | 42.59 | 92.14 | 0.19 | 92.01 | | Realty Income Corp | 14569.48 | 4.26 | 51.33 | 13.36 | 26.03 | 218.67 | 0.18 | 177.89 | | American Tower Corp | 45448.56 | 2.01 | 49.11 | 7.84 | 15.96 | 98.71 | 0.10 | 50.02 | | Host Hotels & Resorts Inc | 12525.92 | 4.94 | 16.49 | 2.32 | 14.07 | 81.46 | 0.08 | 63.47 | | VEREIT Inc | 8158.71 | 6.56 | - | 6.10 | 0.00 | -0.00 | 0.07 | -15.58 | | Welltower Inc | 22647.35 | 5.51 | 24.05 | 5.35 | 22.25 | 132.52 | 0.05 | 115.11 | | Kimco Realty Corp | 11097.43 | 3.93 | 34.94 | 9.68 | 27.70 | 137.31 | 0.04 | 114.47 | | Vornado Realty Trust | 18261.57 | 2.62 | 77.06 | 7.29 | 9.46 | 201.90 | 0.03 | 118.68 | | Weyerhaeuser Co | 23952.83 | 3.89 | 41.24 | 3.49 | 8.46 | 160.42 | 0.03 | 112.03 | | Regency Centers Corp | 6979.72 | 3.00 | 53.95 | 11.93 | 22.11 | 161.85 | 0.02 | 114.38 | | General Growth Properties Inc | 22427.66 | 3.56 | 22.90 | 7.87 | 34.37 | 81.52 | 0.02 | 77.36 | | Crown Castle International Corp | 30455.03 | 4.24 | 86.90 | 7.87 | 9.06 | 368.46 | 0.02 | 274.98 | | Boston Properties Inc | 18854.16 | 2.29 | 44.22 | 7.38 | 16.69 | 101.26 | 0.01 | 58.09 | | Federal Realty Investment Trust | 10073.84 | 2.74 | 39.46 | 12.61 | 31.96 | 108.12 | -0.01 | 84.96 | | Simon Property Group Inc | 56719.87 | 3.61 | 28.78 | 10.16 | 35.30 | 103.90 | -0.01 | 94.76 | | HCP Inc | 13692.84 | 7.30 | 21.94 | 5.49 | 25.02 | 160.16 | -0.04 | 147.56 | | Essex Property Trust Inc | 13978.14 | 2.98 | 50.12 | 10.81 | 21.57 | 149.36 | -0.05 | 105.11 | | UDR Inc | 8926.10 | 3.53 | 87.61 | 9.36 | 10.68 | 309.26 | -0.07 | 216.62 | | SL Green Realty Corp | 10850.58 | 2.77 | 64.50 | 5.84 | 9.05 | 178.67 | -0.08 | 107.49 | | AvalonBay Communities Inc | 22051.79 | 3.35 | 26.59 | 10.84 | 40.77 | 89.08 | -0.09 | 87.51 | | Macerich Co/The | 9895.47 | 6.24 | 23.62 | 9.51 | 40.26 | 147.39 | -0.10 | 148.28 | | Equity Residential | 21590.20 | 15.67 | 5.18 | 8.93 | 99.99 | 81.17 | -0.11 | 232.63 | | Public Storage | 35629.83 | 3.56 | 30.62 | 13.90 | 45.40 | 109.01 | -0.12 | 108.01 | | CBRE Group Inc | 9929.50 | - | 13.80 | 0.75 | 5.43 | -0.00 | -0.21 | -24.22 |
Top 5 ML Global Real Estate Long Picks | value | stock | MarketCap | DividendYield | PE | PS | NetMarginPct | PayoutRatio | 52wkchange | score | | SOHO China Ltd | 410:HK | 2755.36 | 6.80 | 51.59 | 11.86 | 22.99 | 350.81 | 0.47 | 307.03 | | Crown Castle International Corp | CCI:US | 30455.03 | 4.24 | 86.90 | 7.87 | 9.06 | 368.46 | 0.02 | 274.98 | | Equity Residential | EQR:US | 21590.20 | 15.67 | 5.18 | 8.93 | 99.99 | 81.17 | -0.11 | 232.63 | | UDR Inc | UDR:US | 8926.10 | 3.53 | 87.61 | 9.36 | 10.68 | 309.26 | -0.07 | 216.62 | | Realty Income Corp | O:US | 14569.48 | 4.26 | 51.33 | 13.36 | 26.03 | 218.67 | 0.18 | 177.89 |
Top 5 ML Global Real Estate Short Picks| value | stock | MarketCap | DividendYield | PE | PS | NetMarginPct | PayoutRatio | 52wkchange | score | | CBRE Group Inc | CBG:US | 9929.50 | - | 13.80 | 0.75 | 5.43 | 0.00 | -0.21 | -24.22 | | Daelim Industrial Co Ltd | 000210:KS | 2284.16 | 0.39 | 8.15 | 0.26 | 3.19 | 3.18 | 0.04 | -17.39 | | Unitech Ltd | UT:IN | 186.82 | - | - | - | 0.00 | 0.00 | -0.33 | -15.98 | | Mitsubishi Estate Co Ltd | 8802:JP | 27504.30 | 0.75 | 33.77 | 2.79 | 8.26 | 25.33 | -0.07 | -15.90 | | Poly Property Group Co Ltd | 119:HK | 1180.26 | 0.40 | - | 0.33 | 0.00 | 0.00 | 0.00 | -15.65 |
xxxxxxxxxxxxxxxxxxxxxxxxxxxxxxxxxxx
xxxxxxxxxxxxxxxxxxxxxxxxxxxxxxxxxxx
Weekly Fund flow into focused funds showed (Previous Week)74.5 USD mn of inflow
Weekly Fund flow into focused funds showed (Previous Week)-29.0 USD mn of outflow.
Weekly Fund flow into focused funds showed (Previous Week)-2993.5 USD mn of outflow.
Weekly Fund flow into focused funds showed (Previous Week)-56.5 USD mn of outflow.
Weekly Fund flow into focused funds showed (Previous Week)-5.6 USD mn of outflow.
Weekly Fund flow into focused funds showed (Previous Week)-567.0 USD mn of outflow.
Weekly Fund flow into focused funds showed (Previous Week)2.9 USD mn of inflow
Weekly Fund flow into focused funds showed (Previous Week)-268.8 USD mn of outflow.
Weekly Fund flow into focused funds showed (Previous Week)-2.6 USD mn of outflow.
Weekly Fund flow into focused funds showed (Previous Week)299.9 USD mn of inflow
Weekly Fund flow into focused funds showed (Previous Week)-116.1 USD mn of outflow.
Weekly Fund flow into focused funds showed (Previous Week)-24.2 USD mn of outflow.
Weekly Fund flow into focused funds showed (Previous Week)418.8 USD mn of inflow
Weekly Fund flow into focused funds showed (Previous Week)-15.3 USD mn of outflow.
Weekly Fund flow into focused funds showed (Previous Week)-41.8 USD mn of outflow.
Weekly Fund flow into focused funds showed (Previous Week)-119.3 USD mn of outflow.
Weekly Fund flow into focused funds showed (Previous Week)-16.9 USD mn of outflow.
Weekly Fund flow into focused funds showed (Previous Week)-248.6 USD mn of outflow.
Weekly Fund flow into focused funds showed (Previous Week)26.1 USD mn of inflow
Weekly Fund flow into focused funds showed (Previous Week)-60.6 USD mn of outflow.
Weekly Fund flow into focused funds showed (Previous Week)60.3 USD mn of inflow
Weekly Fund flow into focused funds showed (Previous Week)35.6 USD mn of inflow
Weekly Fund flow into focused funds showed (Previous Week)-22.5 USD mn of outflow.
Weekly Fund flow into focused funds showed (Previous Week)3.1 USD mn of inflow
Weekly Fund flow into focused funds showed (Previous Week)-1.9 USD mn of outflow.
Weekly Fund flow into focused funds showed (Previous Week)-161.3 USD mn of outflow.
Weekly Fund flow into focused funds showed (Previous Week)-28.5 USD mn of outflow.
Weekly Fund flow into focused funds showed (Previous Week)59.5 USD mn of inflow
Weekly Fund flow into focused funds showed (Previous Week)-881.4 USD mn of outflow.
Weekly Fund flow into focused funds showed (Previous Week)-2.9 USD mn of outflow.
Weekly Fund flow into focused funds showed (Previous Week)-324.6 USD mn of outflow.
Weekly Fund flow into focused funds showed (Previous Week)-1045.0 USD mn of outflow.
Weekly Fund flow into focused funds showed (Previous Week)10.8 USD mn of inflow
Weekly Fund flow into focused funds showed (Previous Week)-1586.0 USD mn of outflow.
Weekly Fund flow into focused funds showed (Previous Week)-159.4 USD mn of outflow.
Weekly Fund flow into focused funds showed (Previous Week)-9.0 USD mn of outflow.
Weekly Fund flow into focused funds showed (Previous Week)-27.8 USD mn of outflow.
Weekly Fund flow into focused funds showed (Previous Week)320.5 USD mn of inflow
Weekly Fund flow into focused funds showed (Previous Week)1151.4 USD mn of inflow
Weekly Fund flow into focused funds showed (Previous Week)298.5 USD mn of inflow
Weekly Fund flow into focused funds showed (Previous Week)-606.5 USD mn of outflow.
Weekly Fund flow into focused funds showed (Previous Week)-47.0 USD mn of outflow.
Weekly Fund flow into focused funds showed (Previous Week)254.1 USD mn of inflow
Weekly Fund flow into focused funds showed (Previous Week)-899.1 USD mn of outflow.
Weekly Fund flow into focused funds showed (Previous Week)-4.0 USD mn of outflow.
Weekly Fund flow into focused funds showed (Previous Week)-239.8 USD mn of outflow.
Weekly Fund flow into focused funds showed (Previous Week)-2.5 USD mn of outflow.
Weekly Fund flow into focused funds showed (Previous Week)-573.3 USD mn of outflow.
Weekly Fund flow into focused funds showed (Previous Week)0.1 USD mn of inflow
Weekly Fund flow into focused funds showed (Previous Week)-7.6 USD mn of outflow.
Weekly Fund flow into focused funds showed (Previous Week)-9789.7 USD mn of outflow.
Weekly Fund flow into focused funds showed (Previous Week)2640.1 USD mn of inflow
Weekly Fund flow into focused funds showed (Previous Week)893.8 USD mn of inflow
Top 10 Focused Funds by Inflows Last Week
| Fund Name | fund flow mn$ | Total Assets mn$ | | FI TESOURO RENDA FIXA (NSCXTES) | 891.6 | 4065.8 | | SPDR S&P MIDCAP 400 ETF TRUST (MDY) | 829.4 | 17232.9 | | SPDR S&P MIDCAP 400 ETF TRUST (XMDYX) | 829.4 | 17232.9 | | ISHARES CORE S&P MID-CAP ETF (IJH) | 621.6 | 31482.4 | | VANGUARD INVESTMENT SERIES PLC - GLOBAL STOCK INDEX FUND - INVESTOR CLASS USD (VANGIVI) | 505.7 | 8068.9 | | ISHARES CORE S&P SMALL-CAP ETF (IJR) | 448.2 | 23901.0 | | ISHARES MSCI NORTH AMERICA UCITS ETF (INAA) | 422.5 | 1672.7 | | ISHARES MSCI JAPAN ETF (EWJ) | 391.2 | 14310.4 | | ISHARES RUSSELL 1000 GROWTH ETF (IWF) | 308.6 | 30494.6 | | VANGUARD INVESTMENT SERIES PLC - JAPAN GOVERNMENT BOND INDEX FUND - INVESTOR $ (VANJGBU) | 269.8 | 633.5 |
Top 10 Focused Funds by Outflow Last Week
| Fund Name | fund flow mn$ | Total Assets mn$ | | SPDR S&P 500 ETF TRUST (SPY) | -4177.6 | 99999.9 | | NOMURA TOPIX EXCHANGE TRADED FUND (01312017) | -1873.3 | 31846.3 | | NOMURA ETF - NIKKEI 225 EXCHANGE TRADED FUND (1321) | -1860.5 | 34562.3 | | NOMURA ETF - NIKKEI 225 EXCHANGE TRADED FUND (01311017) | -1859.1 | 34562.3 | | SPDR GOLD SHARES (GLD) | -1629.4 | 36579.3 | | ISHARES GOLD TRUST (I6HB) | -485.8 | 8323.2 | | ISHARES GOLD TRUST (I6HB) | -485.3 | 8323.2 | | CONSUMER STAPLES SELECT SECTOR SPDR FUND (SD7I) | -463.2 | 7844.9 | | ISHARES CORE S&P 500 ETF (ISQ2) | -436.5 | 84770.9 | | FIRST STATE INVESTMENTS ICVC - ASIA PACIFIC LEADERS FUND - AEUR INC (FSAPAEI) | -416.6 | 11695.0 |
|
|
|
|