Midlincoln Aggregates for funds
for week ending last Friday (inclusive)
| Focus | Objective | Asset Class | Flow USD mn |
| Commodities | INDUSTRIAL METALS | Commodity | 8.05 |
| Commodities | PRECIOUS METAL SECTOR | Equity | 62.90 |
| Commodities | PRECIOUS METALS | Commodity | 1541.63 |
| Commodities | PRECIOUS METALS | Mixed Allocation | 10.05 |
| country | AUSTRALIA | Equity | 127.92 |
| country | AUSTRALIA | Fixed Income | 7.27 |
| country | AUSTRALIA | Mixed Allocation | -0.24 |
| country | BRAZIL | Equity | -4.27 |
| country | BRAZIL | Fixed Income | 273.94 |
| country | CHINA | Equity | -361.40 |
| country | CHINA | Fixed Income | -18.83 |
| country | INDIA | Equity | 256.72 |
| country | INDIA | Fixed Income | -3.89 |
| country | ISRAEL | Equity | 0.16 |
| country | JAPAN | Equity | -57897.36 |
| country | JAPAN | Fixed Income | 37.39 |
| country | KOREA | Equity | -23.31 |
| country | POLAND | Equity | -0.46 |
| country | RUSSIA | Equity | -111.61 |
| country | RUSSIA | Fixed Income | -3.37 |
| country | SOUTH AFRICA | Equity | 3.27 |
| country | SPAIN | Equity | -12.42 |
| Country | TAIWAN | Equity | 4.49 |
| country | TURKEY | Equity | -2.22 |
| country | UNITED KINGDOM | Equity | -17.04 |
| industry | BASIC MATERIALS SECTOR | Equity | 9.87 |
| industry | COMMUNICATIONS SECTOR | Equity | 2.96 |
| industry | ENERGY SECTOR | Equity | 62.04 |
| industry | FINANCIAL SECTOR | Equity | -3.04 |
| industry | HEALTH CARE SECTOR | Equity | 65.26 |
| industry | INDUSTRIAL SECTOR | Equity | -0.21 |
| industry | MULTIPLE SECTOR | Equity | 0.00 |
| industry | NATURAL RESOURCES SECTOR | Equity | -97.84 |
| industry | REAL ESTATE SECTOR | Alternative | -0.62 |
| industry | REAL ESTATE SECTOR | Equity | 78.08 |
| industry | TECHNOLOGY SECTOR | Equity | -13.10 |
| industry | UTILITIES SECTOR | Equity | -28.22 |
| region | AFRICAN REGION | Equity | 28.19 |
| region | AFRICAN REGION | Fixed Income | 0.00 |
| region | ASIAN PACIFIC REGION | Equity | 45.73 |
| region | ASIAN PACIFIC REGION | Fixed Income | 121.36 |
| region | ASIAN PACIFIC REGION EX JAPAN | Equity | 108.90 |
| region | ASIAN PACIFIC REGION EX JAPAN | Fixed Income | -160.21 |
| region | ASIAN PACIFIC REGION EX JAPAN | Mixed Allocation | 0.00 |
| region | EASTERN EUROPEAN REGION | Equity | 17.61 |
| region | EASTERN EUROPEAN REGION | Fixed Income | 4.91 |
| region | EUROPEAN REGION | Equity | -602.18 |
| region | EUROPEAN REGION | Fixed Income | 77.42 |
| region | EUROPEAN REGION | Mixed Allocation | 0.15 |
| region | LATIN AMERICAN REGION | Equity | -39.12 |
| region | LATIN AMERICAN REGION | Fixed Income | -88.30 |
| region | MIDDLE EAST REGION | Equity | -6.27 |
| region | MIDDLE EAST REGION | Fixed Income | 0.75 |
| region | NORDIC REGION | Equity | -4.62 |
| region | NORTH AMERICAN REGION | Equity | 136.74 |
| region | NORTH AMERICAN REGION | Fixed Income | 0.19 |
| Risk | GOVERNMENT BOND | Fixed Income | -1.78 |
| Risk | GOVERNMENT BOND | Mixed Allocation | 0.00 |
| Risk | INFLATION PROTECTED | Brazil | -0.17 |
| Risk | INFLATION PROTECTED | Fixed Income | 256.61 |
| Risk | LONG SHORT | Alternative | -169.34 |
| Risk | LONG SHORT | Equity | -7963.62 |
| Risk | LONG SHORT | Fixed Income | 3.03 |
| Risk | LONG SHORT | Mixed Allocation | -0.01 |
| Sector | AGRICULTURE | Commodity | -1.21 |
| Sector | AGRICULTURE | Equity | 0.00 |
| Sector | CONSUMER DISCRETIONARY | Equity | 3.04 |
| Sector | CONSUMER STAPLES | Equity | 8.59 |
| segment | BRIC | Equity | -3.08 |
| segment | BRIC | Fixed Income | -0.13 |
| segment | DEVELOPED MARKETS | Equity | -373.81 |
| segment | EMEA | Equity | 0.91 |
| segment | EMEA | Fixed Income | 1.20 |
| segment | EMERGING MARKETS | Equity | -349.14 |
| segment | GCC | Equity | -12.51 |
| segment | GCC | Fixed Income | 0.00 |
| segment | GCC | Mixed Allocation | 0.03 |
| segment | MENA | Equity | 0.50 |
| segment | MENA | Fixed Income | 0.22 |
| Size | LARGE-CAP | Equity | -1192.00 |
| Size | MID-CAP | Commodity | 0.25 |
| Size | MID-CAP | Equity | -21.04 |
| Size | SMALL-CAP | Equity | -35.35 |
Source: Midlincoln Research
Fund Aggregates

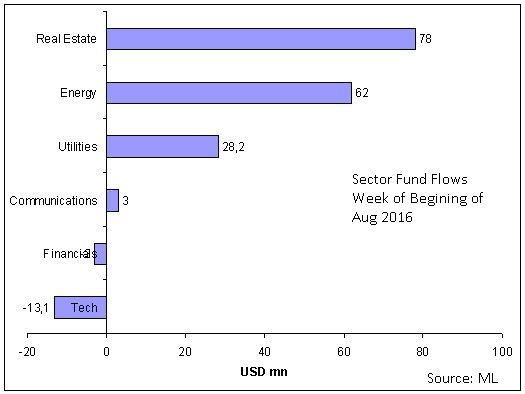
Chart: Weekly Equity Sector Flows out of Tech into Realestate and Energy
Source: ML
Emerging markets fund flow showed -349.1 USD mn of outflow.. While Frontier Markets funds showed -0.2 USD mn of outflows.
BRAZIL Equity funds showed -4.3 USD mn of outflow.
BRAZIL Fixed Income funds showed 273.9 USD mn of inflow.
CHINA Equity funds showed -361.4 USD mn of outflow.
CHINA Fixed Income funds showed -18.8 USD mn of outflow.
INDIA Equity funds showed 256.7 USD mn of inflow.
INDIA Fixed Income funds showed -3.9 USD mn of outflow.
KOREA Equity funds showed -23.3 USD mn of outflow.
RUSSIA Equity funds showed -111.6 USD mn of outflow.
RUSSIA Fixed Income funds showed -3.4 USD mn of outflow.
SOUTH AFRICA Equity funds showed 3.3 USD mn of inflow.
TURKEY Equity funds showed -2.2 USD mn of outflow.
COMMUNICATIONS SECTOR Equity funds showed 3.0 USD mn of inflow.
ENERGY SECTOR Equity funds showed 62.0 USD mn of inflow.
FINANCIAL SECTOR Equity funds showed -3.0 USD mn of outflow.
REAL ESTATE SECTOR Alternative funds showed -0.6 USD mn of outflow.
REAL ESTATE SECTOR Equity funds showed 78.1 USD mn of inflow.
TECHNOLOGY SECTOR Equity funds showed -13.1 USD mn of outflow.
UTILITIES SECTOR Equity funds showed -28.2 USD mn of outflow.
LONG SHORT Alternative funds showed -169.3 USD mn of outflow.
LONG SHORT Equity funds showed -7963.6 USD mn of outflow.
LONG SHORT Fixed Income funds showed 3.0 USD mn of inflow.
LONG SHORT Mixed Allocation funds showed 0.0 USD mn of inflow.
It is worth noting that MidLincoln data shows flow dynamics for last week ending last Friday where as EPFR data reports data only to last Wednesday, which makes ML data far more relevant
Top 5 fund winners and Top 5 losers by country by inflow
Russia Inflows
| assclass | profile | flow USD mln$ |
| Equity | HSBC Global Investment Funds - Russia Equity | 24.42 |
| Equity | HSBC MSCI Russia Capped UCITS ETF $ is a | 4.82 |
| Equity | HSBC Global Investment Funds - Russia Equity | 4.71 |
| Equity | JPMorgan Funds - Russia Fund is an open-end | 4.27 |
| Equity | JPMorgan Funds - Russia Fund is an open-end | 3.98 |
Russia Outflows
| assclass | profile | flow USD mln$ |
| Equity | Market Vectors Russia ETF is an exchange-traded | -80.07 |
| Equity | LYXOR ETF RUSSIA Dow Jones Russia GDR - D | -21.03 |
| Equity | LYXOR ETF RUSSIA (Dow Jones Russia GDR) - | -20.69 |
| Equity | Swedbank Robur Rysslandsfonden is an open-end | -12.85 |
| Equity | iShares MSCI Russi a ADR/GDR UCITS ETF | -8.12 |
Source: MidLincoln Research
China Inflows
| assclass | profile | flow USD mln$ |
| Equity | HSBC Global Investment Funds - Chinese Equity | 20.68 |
| Equity | W.I.S.E. - CSI 300 China Tracker� is an index-tracking | 18.66 |
| Equity | K China Equity Fund is an open-ended fund | 3.01 |
| Equity | KB China Mainland A Share Leverage Securities | 1.45 |
| Equity | HSBC Global Investment Funds - Chinese | 1.35 |
China Outflows
| assclass | profile | flow USD mln$ |
| Equity | Hang Seng Investment Index Funds Series - | -99.99 |
| Equity | First State Global Umbrella PLC - China | -74.08 |
| Equity | ChinaAMC ETF Series - ChinaAMC CSI 300 Index | -55.34 |
| Equity | iShares China Large-Cap ETF is an exchange-traded | -51.29 |
| Equity | LYXOR UCITS ETF CHINA ENTERPRISE HSCEI - | -46.57 |
Source: MidLincoln Research
South Africa Inflows
| assclass | profile | flow USD mln$ |
| Equity | iShares MSCI South Africa UCITS ETF is an | 2.82 |
| Equity | NEXT FUNDS FTSE/JSE Africa Top40 Linked Exchange | 0.45 |
| Equity | NEXT FUNDS FTSE/JSE Africa Top40 Linked | 0.00 |
South Africa Outflows
| assclass | profile | flow USD mln$ |
| Equity | NEXT FUNDS FTSE/JSE Africa Top40 Linked | 0.00 |
| Equity | NEXT FUNDS FTSE/JSE Africa Top40 Linked Exchange | 0.45 |
| Equity | iShares MSCI South Africa UCITS ETF is an | 2.82 |
Source: MidLincoln Research
Korea Inflows
| assclass | profile | flow USD mln$ |
| Equity | Korea Equity Fund, Inc. is a non-diversified, | 7.21 |
| Equity | Lyxor ETF MSCI Korea is a UCITS compliant | 3.11 |
| Equity | WisdomTree Korea Hedged Equity Fund is an | 0.24 |
| Equity | Korea Equity Fund, Inc. is a non-diversified, | 0.00 |
| Equity | JPMorgan Funds - Korea Equity is an open-end | -0.14 |
Korea Outflows
| assclass | profile | flow USD mln$ |
| Equity | iShares MSCI South Korea Capped ETF is an | -22.71 |
| Equity | INVESCO Korean Equity Fund is a UCITS | -2.97 |
| Equity | INVESCO Korean Equity Fund is a UCITS certified | -2.81 |
| Equity | JPMorgan Funds - Korea Equity is an open-end | -2.40 |
| Equity | db x-trackers - MSCI Korea TRN Index UCITS | -1.56 |
Source: MidLincoln Research
India Inflows
| assclass | profile | flow USD mln$ |
| Equity | Aberdeen Global - India Equity Fund is | 99.99 |
| Equity | Aberdeen Global - India Equity Fund is | 99.99 |
| Equity | Morgan Stanley India Investment Fund, Inc. | 61.30 |
| Equity | The Lyxor ETF MSCI India is a UCITS compliant | 27.14 |
| Equity | HSBC Global Investment Funds - Indian Equity | 13.83 |
India Outflows
| assclass | profile | flow USD mln$ |
| Equity | WisdomTree India Earnings Fund is an exchange-traded | -37.52 |
| Equity | GS India Equity Portfolio is a Portfolio | -22.55 |
| Equity | db x-trackers CNX Nifty UCITS ETF is a UCITS | -20.59 |
| Equity | iShares MSCI India ETF is an exchange-traded | -17.68 |
| Equity | Vontobel India Fund is an open-end fund | -14.21 |
Source: MidLincoln Research
Turkey Inflows
| assclass | profile | flow USD mln$ |
| Equity | iShares MSCI Turkey UCITS ETF is an open-end, | -2.22 |
Turkey Outflows
| assclass | profile | flow USD mln$ |
| Equity | iShares MSCI Turkey UCITS ETF is an open-end, | -2.22 |
Source: MidLincoln Research
Brazil Inflows
| assclass | profile | flow USD mln$ |
| Fixed Income | Fondo Mutuo Security Fixed Income BRL is | 99.99 |
| Equity | JPMorgan Funds - Brazil Equity is an open-end | 8.70 |
| Equity | JPMorgan Funds - Brazil Equity is an open-end | 8.62 |
| Equity | iShares MSCI Brazil UCITS ETF (Dist) is an | 2.50 |
| Equity | ProShares UltraShort MSCI Brazil Capped is short | 1.94 |
Brazil Outflows
| assclass | profile | flow USD mln$ |
| Equity | Lyxor ETF Brazil (Ibovespa) USD is an exchange | -19.26 |
| Equity | Direxion Daily Brazil Bull 3x Shares is an | -7.01 |
| Fixed Income | UBS (Lux) Bond Sicav - Brazil is an open-end | -2.07 |
| Fixed Income | Santander FIC FI Renda Fixa I Credito Privado | -1.08 |
| Equity | db x-trackers - MSCI Brazil TRN Index UCITS | -0.74 |
Source: MidLincoln Research
Australia Inflows
| assclass | profile | flow USD mln$ |
| Equity | iShares MSCI Australia UCITS ETF is an open-end, | 99.99 |
| Equity | UBS (Lux) Equity Fund - Australia (AUD) is | 12.44 |
| Equity | Australia Equity Income Fund is an open-end | 11.84 |
| Fixed Income | 7.13 | |
| Equity | Candriam Equities L - Australia is a SICAV | 5.44 |
Australia Outflows
| assclass | profile | flow USD mln$ |
| Equity | Candriam Equities L - Australia is a SICAV | -4.68 |
| Equity | Baring International Umbrella - Baring Australia | -4.33 |
| Equity | WisdomTree Australia Dividend Fund is an | -0.49 |
| Mixed Allocation | Commonwealth Australia/New Zealand Fund | -0.24 |
| Fixed Income | ZKB-CIF I Australia Govt. Bond Index is | -0.03 |
Source: MidLincoln Research
Canada Inflows
Canada Outflows
Source: MidLincoln Research
Good luck! And don’t stay out of the market for too long. As the policy of being too cautious is the greatest risk of all.
Ovanes Oganisyan