ML Agribusiness
By: Research Team

Description
Covering Global Agribusiness
Comment
Best last week among stocks was Associated British Foods PLC (ABF:LN) +9.29%, MHP SA (MHPC:LI) +8.33%, Astra Agro Lestari Tbk PT (AALI:IJ) +3.05%,
While worst last week among stocks was CF Industries Holdings Inc (CF:US) -13.10%, Mosaic Co/The (MOS:US) -4.38%, Archer-Daniels-Midland Co (ADM:US) -2.67%,
Best last month among stocks was Felda Global Ventures Holdings Bhd (FGV:MK) +23.33%, Kernel Holding SA (0KE:GR) +20.80%, Bunge Ltd (BG:US) +12.79%,
While worst last month among stocks was CF Industries Holdings Inc (CF:US) -8.96%, Potash Corp of Saskatchewan Inc (POT:CN) -6.75%, Sociedad Quimica y Minera de Chile SA (SQM/B:CI) -4.78%,
Best YTD among stocks was Charoen Pokphand Indonesia Tbk PT (CPIN:IJ) +57.60%, Tyson Foods Inc (TSN:US) +38.56%, Kernel Holding SA (0KE:GR) +34.38%,
While worst YTD among stocks was CF Industries Holdings Inc (CF:US) -46.40%, Incitec Pivot Ltd (IPL:AU) -24.00%, Yara International ASA (YAR:NO) -21.68%,
Chart: More Crops are Used for Animal Feeds
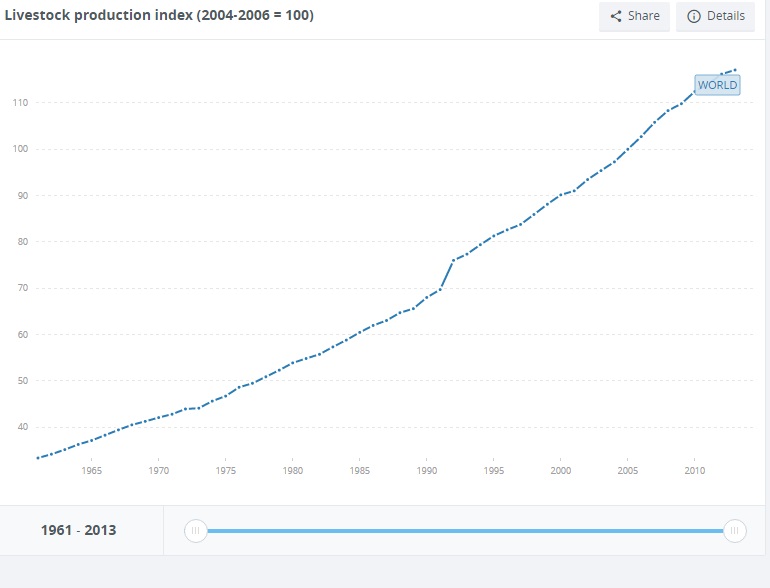
Source: WorldBank
Chart: Ferts Consumption Made a Big Jump

Source: WorldBank
Chart: Despite That Land under Cereals Has been Flat for A while
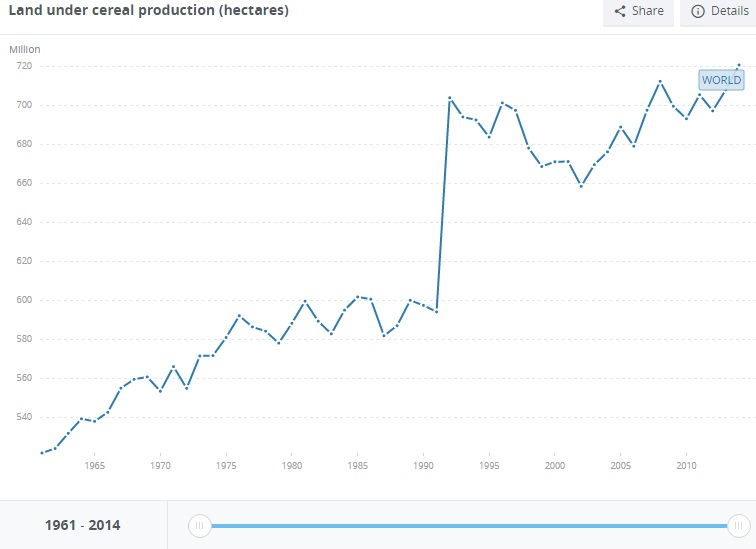
Source: WorldBank
Chart: To Produce More Food
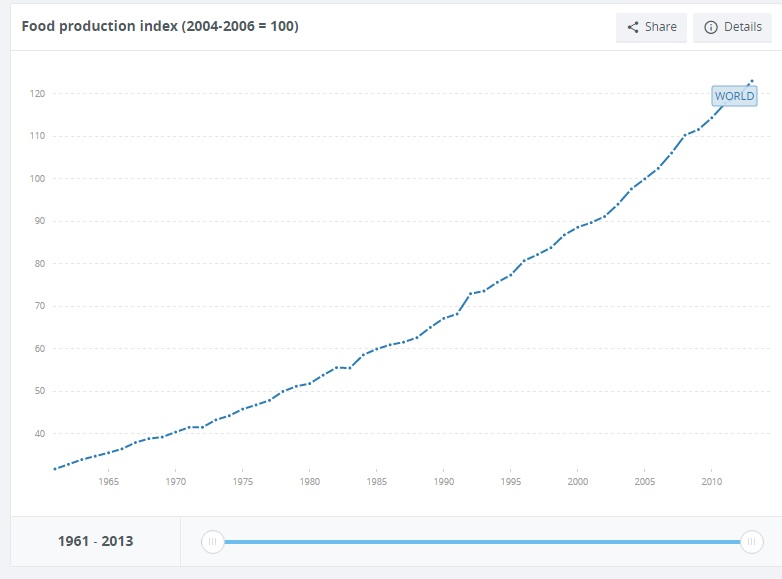
Source: WorldBank
Chart: And Crops are Rising
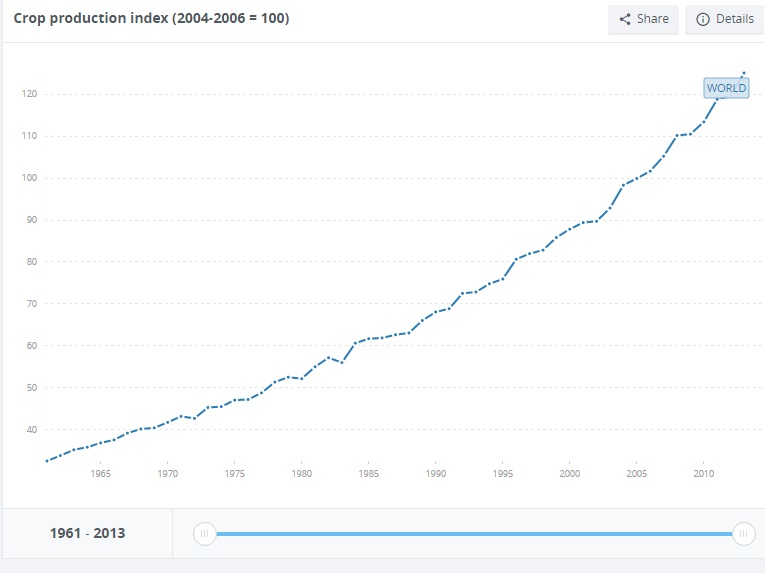
Source: WorldBank
Chart: Cereal Yields are on the Rise
As productivity improves
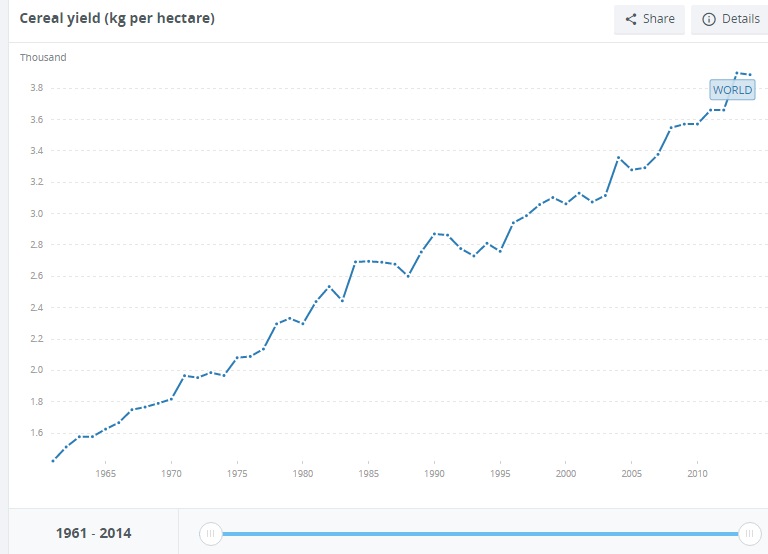
Source: WorldBank
Chart: But Arable Land Per Capital of Global Population is Rapidly Declining
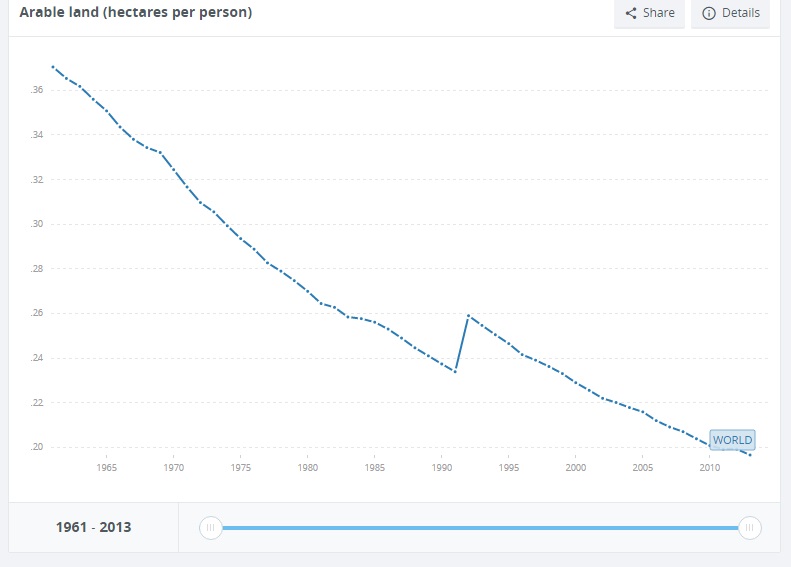
Source: WorldBank
Chart: Arable Land % of Total Has Been Stable for a While

Source: WorldBank
Chart: Contribution to Global GDP from Agribusiness is Falling

Source: WorldBank
Chart: Defarming is On Going

Source: WorldBank
Chart: Agri Machinery Usage is on the Rise
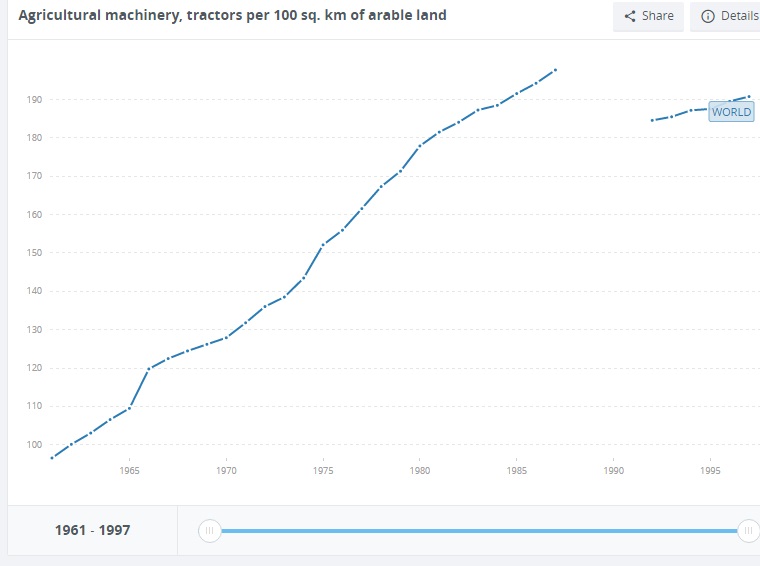
Source: WorldBank
Chart: Agricultural Land % of Total
Peaked around 90tis and stable

Source: WorldBank
Agriculture Finance
Africa: Agriculture Sector Players Commit to Increase Agriculture ...Rwanda: BDF, 450 Microfinance Institutions Partner to Ease ...BRD to extend Rwf 80 billion to agriculture financingAfDB Makes USD 9 Million Equity Investment in Fund for Agricultural ...Agricultural financing gets massive boost
Agricultural Land Prices
UNL Releases 2016 Nebraska Farmland Values and Rental RatesFarmland prices blossom in stateUK Farmland's Bull Run Is Over After Brexit Puts Subsidies in DoubtLatest Washington real-estate gold rush: farmsSheldon seeks fair, transparent farmland preservation program in ...
Agricultural Commodities
Chicago agricultural commodities close lower as favorable weather ...Agricultural Commodities AwakenExports of seven agricultural commodities fall in May on weak global ...GRAINS-US soybeans sag on weather, prospects for big cropRugby-Wallabies recall five from France for Rugby Championship
Fertilizers
Global Micronutrient Fertilizers Market Worth USD 5374.4 Million by ...Global Phosphate Fertilizers (MAP, DAP, Rock Phosphate and ...Earth Restorative Company Launches Break-Through Line of Plant ...Natural Gas Price Movements for Nitrogen Fertilizers Last WeekResearchers partner with brewery to collect urine and generate ...
Productivity in Agriculture
Ethiopia: GTP I's Performance in the Agriculture's Sector and Hopes ...PM Narendra Modi to Niti Aayog: Consider broader goals for ...Increased productivity with intensive rotational cell grazing and ...Photo: Erin Gray/Mercy CorpsFPCCI for setting of agriculture desk to increase productivityCountry Composition
| Country | Weight % |
| United States
| 28.13 |
| Malaysia
| 12.50 |
| Indonesia
| 6.25 |
| Ukraine
| 6.25 |
| Russian Federation
| 6.25 |
| United Kingdom
| 6.25 |
| Canada
| 6.25 |
| Chile
| 3.13 |
| Taiwan
| 3.13 |
| France
| 3.13 |
| Singapore
| 3.13 |
| Switzerland
| 3.13 |
| Hong Kong (SAR)
| 3.13 |
| Australia
| 3.13 |
| Norway
| 3.13 |
| China
| 3.13 |
Loading graph...
/Sector Composition
| Country | Weight % |
| United States
| 28.13 |
| Malaysia
| 12.50 |
| Indonesia
| 6.25 |
| Ukraine
| 6.25 |
| Russian Federation
| 6.25 |
| United Kingdom
| 6.25 |
| Canada
| 6.25 |
| Chile
| 3.13 |
| Taiwan
| 3.13 |
| France
| 3.13 |
| Singapore
| 3.13 |
| Switzerland
| 3.13 |
| Hong Kong (SAR)
| 3.13 |
| Australia
| 3.13 |
| Norway
| 3.13 |
| China
| 3.13 |
Loading graph...
Key Basket Multiples
| Stocks | Total MCap US mn | Payout Ratio | Div Yield | PE | NetMargin | 1yr Return |
| 32 | 319480.6 | 43.1 | 2.6 | 21.88 | 8.30 | 2.3 |
Results
2015-11-03 Archer-Daniels-Midland Co
Cons
Archer Daniels Midland Co. (ADM) Posts Quarterly Earnings Results ...Consumer Goods Stocks Technical Report -- Archer-Daniels ...
2015-11-23 Tyson Foods Inc
Cons
Tyson Foods, Inc. (NYSE:TSN) To Report June 2016 ResultsAnalysts: Tyson Foods, Inc. (NYSE:TSN) stock is worth $75.73
2015-11-25 Deere & Co
industr
Two Davenport men killed in early Thursday accidentDeere & Company Net Income Is Trending Lower
2015-11-03 Mosaic Co/The
mater
CropNutrition.com Now Mobile OptimizedCargill looks to the future with an eye on costs
2015-11-05 CF Industries Holdings Inc
mater
CF Industries Holdings (CF) W. Anthony Will on Q2 2016 Results ...CF Industries Holdings, Inc. Reports Second Quarter Net Earnings of ...
| value | stock | Country | Industry | MCap US mn | DividendYield | PE | PS | NetMarginPct | PayoutRatio | 52wkchange | Score |
| Incitec Pivot Ltd | IPL:AU | Australia
| Agricultural Chemicals | 3581.10 | 5.43% | 16.50 | 1.31 | 7.94 | 89.60 | -20.71 | 29.63 |
| Agrium Inc | AGU:CN | Canada
| Agricultural Chemicals | 12323.94 | 3.92% | 13.87 | 0.88 | 6.34 | 54.37 | -9.91 | 6.25 |
| Potash Corp of Saskatchewan Inc | POT:CN | Canada
| Agricultural Chemicals | 13031.23 | 6.43% | 16.88 | 2.53 | 14.99 | 108.54 | -39.88 | 36.08 |
| Sociedad Quimica y Minera de Chile SA | SQM/B:CI | Chile
| Agricultural Chemicals | 6977.24 | 0.71% | 32.31 | 3.73 | 11.54 | 22.94 | 83.38 | 54.86 |
| China BlueChemical Ltd | 3983:HK | China
| Agricultural Chemicals | 944.97 | 5.94% | 7.55 | 0.58 | 7.68 | 44.85 | -36.64 | -22.35 |
| Eridania Beghin-Say | BG:LN | France
| Agricultural Producers | 0.00 | - | - | - | 0.00 | 0.00 | 0.02 | -30.67 |
| China Agri-Industries Holdings Ltd | 606:HK | Hong Kong (SAR)
| Agricultural Producers | 1840.94 | - | - | 0.17 | 0.00 | 0.00 | -17.90 | -48.59 |
| Charoen Pokphand Indonesia Tbk PT | CPIN:IJ | Indonesia
| Agricultural Producers | 4826.59 | 0.75% | 24.51 | 1.88 | 7.67 | 18.38 | 55.46 | 26.32 |
| Astra Agro Lestari Tbk PT | AALI:IJ | Indonesia
| Agricultural Producers | 2225.05 | - | 25.93 | 2.06 | 7.94 | -0.00 | -21.79 | -70.47 |
| Felda Global Ventures Holdings Bhd | FGV:MK | Malaysia
| Agricultural Producers | 1703.73 | 2.11% | - | 0.42 | 0.00 | -0.00 | 18.28 | -12.41 |
| PPB Group Bhd | PEP:MK | Malaysia
| Agricultural Producers | 4657.52 | 1.57% | 17.70 | 4.52 | 25.54 | 27.79 | 6.65 | 11.58 |
| Genting Plantations Bhd | GENP:MK | Malaysia
| Agricultural Producers | 2049.67 | 0.57% | 49.46 | 6.19 | 12.52 | 28.19 | 4.49 | -34.95 |
| IOI Corp Bhd | IOI:MK | Malaysia
| Agricultural Producers | 6572.52 | 1.89% | 29.11 | 2.29 | 7.87 | 55.02 | 2.25 | 5.33 |
| Yara International ASA | YAR:NO | Norway
| Agricultural Chemicals | 8619.49 | 5.62% | 7.10 | 0.72 | 10.14 | 39.90 | -31.30 | -19.05 |
| Uralkali PJSC | URKA:RM | Russian Federation
| Agricultural Chemicals | 8150.90 | - | 112.46 | 1.93 | 1.72 | -0.00 | 8.10 | -133.33 |
| Ros Agro PLC | AGRO:LI | Russian Federation
| Agricultural Products Whslrs | 1975.00 | 8.03% | 4.77 | 1.50 | 31.45 | 38.30 | 86.26 | 120.55 |
| Golden Agri-Resources Ltd | E5H:LI | Singapore
| Agricultural Producers | 0.00 | - | - | - | 0.00 | 0.00 | 0.03 | -30.66 |
| Syngenta AG | SYNN:VX | Switzerland
| Agricultural Chemicals | 36540.24 | 2.86% | 30.64 | 2.82 | 9.20 | 87.63 | -3.75 | 31.75 |
| Taiwan Fertilizer Co Ltd | 1722:TT | Taiwan
| Agricultural Chemicals | 1394.92 | 4.66% | 45.05 | 2.62 | 5.82 | 209.93 | 4.19 | 144.20 |
| Kernel Holding SA | 0KE:GR | Ukraine
| Agricultural Producers | 1224.65 | 1.60% | - | - | 0.00 | -0.00 | 39.74 | 9.05 |
| MHP SA | MHPC:LI | Ukraine
| Agricultural Producers | 1030.00 | 7.72% | 11.69 | 0.87 | 7.44 | 90.25 | 11.24 | 66.55 |
| Associated British Foods PLC | ABF:LN | United Kingdom
| Packaged Food | 30571.85 | 1.22% | 30.64 | 1.81 | 5.91 | 37.38 | -8.29 | -26.34 |
| CNH Industrial NV | CNHI:IM | United Kingdom
| Agricultural Machinery | 9513.04 | 2.07% | - | - | 0.00 | -0.00 | -24.18 | -54.87 |
| Tyson Foods Inc | TSN:US | United States
| Packaged Food | 29604.00 | 0.82% | 18.67 | 0.75 | 4.02 | 15.31 | 79.45 | 49.42 |
| Monsanto Co | MON:US | United States
| Agricultural Chemicals | 46567.00 | 2.03% | 24.19 | 3.57 | 14.76 | 49.11 | 6.01 | 14.99 |
| FMC Corp | FMC:US | United States
| Agricultural Chemicals | 6475.00 | 1.36% | 20.91 | 1.94 | 9.28 | 28.44 | 1.47 | -12.42 |
| Archer-Daniels-Midland Co | ADM:US | United States
| Agricultural Producers | 25446.00 | 2.74% | 16.12 | 0.42 | 2.61 | 44.17 | -6.48 | -6.52 |
| Deere & Co | DE:US | United States
| Agricultural Machinery | 24430.00 | 3.09% | 15.12 | 0.90 | 5.95 | 46.72 | -16.09 | -9.23 |
| Bunge Ltd | BG:US | United States
| Agricultural Products Whslrs | 9084.00 | 2.58% | 12.89 | 0.22 | 1.71 | 33.26 | -15.15 | -23.77 |
| AGCO Corp | AGCO:US | United States
| Agricultural Machinery | 3865.00 | 1.11% | 20.38 | 0.54 | 2.65 | 22.62 | -15.07 | -40.87 |
| Mosaic Co/The | MOS:US | United States
| Agricultural Chemicals | 9259.00 | 4.16% | 17.23 | 1.22 | 7.08 | 71.68 | -38.48 | -7.64 |
| CF Industries Holdings Inc | CF:US | United States
| Agricultural Chemicals | 4996.00 | 5.60% | 22.72 | 1.20 | 5.28 | 127.23 | -64.09 | 15.01 |
Index Sector Valuations vs GEM Average
| Sector | Sector MCap US mn | Sector MCap Share in Total | Gem Sector Share In Total GEM | GEM Sector MCAP USmn | Payout Ratio | GEM Payout Ratio | Div Yield | GEM Div Yield | PE | PEGEM | PE Discount vs GEM | NetMargin | NetMarginGEM | Margin Diff. vs GEM | 1yr Return | GEM 1yr Return |
| Consumer Staples | 122811.5 | 38.4 | 7.5 | 584775.3 | 31.2 | 38.0 | 1.8 | 1.8 | 21.9 | 28.2 | -22.3 | 5.9 | 10.3 | 4.4 | 18.7 | 12.3 |
| Industrials | 37808.0 | 11.8 | 5.8 | 453138.2 | 32.5 | 23.4 | 2.6 | 1.8 | 15.8 | 18.6 | -15.1 | 5.5 | 11.4 | 5.9 | -18.0 | 22.9 |
| Materials | 158861.0 | 49.7 | 7.6 | 590209.4 | 56.5 | 27.5 | 3.3 | 3.1 | 23.0 | 18.1 | 27.1 | 10.5 | 9.8 | -0.7 | -5.6 | -0.1 |
Top 5 ML Agribusiness Long Picks
| value | stock | Country | Industry | MCapUSDmn | DividendYield | PE | PS | NetMarginPct | PayoutRatio | 52wkchange | Score |
| Taiwan Fertilizer Co Ltd | 1722:TT | Taiwan
| Agricultural Chemicals | 1394.92 | 4.66% | 45.05 | 2.62 | 5.82 | 209.93 | 4.19 | 144.20 |
| Ros Agro PLC | AGRO:LI | Russian Federation
| Agricultural Products Whslrs | 1975.00 | 8.03% | 4.77 | 1.50 | 31.45 | 38.30 | 86.26 | 120.55 |
| MHP SA | MHPC:LI | Ukraine
| Agricultural Producers | 1030.00 | 7.72% | 11.69 | 0.87 | 7.44 | 90.25 | 11.24 | 66.55 |
| Sociedad Quimica y Minera de Chile SA | SQM/B:CI | Chile
| Agricultural Chemicals | 6977.24 | 0.71% | 32.31 | 3.73 | 11.54 | 22.94 | 83.38 | 54.86 |
| Tyson Foods Inc | TSN:US | United States
| Packaged Food | 29604.00 | 0.82% | 18.67 | 0.75 | 4.02 | 15.31 | 79.45 | 49.42 |
Top 5 ML Agribusiness Short Picks
| value | stock | Country | Industry | MCapUSDmn | DividendYield | PE | PS | NetMarginPct | PayoutRatio | 52wkchange | Score |
| Uralkali PJSC | URKA:RM | Russian Federation
| Agricultural Chemicals | 8150.90 | - | 112.46 | 1.93 | 1.72 | -0.00 | 8.10 | -98.96 |
| Astra Agro Lestari Tbk PT | AALI:IJ | Indonesia
| Agricultural Producers | 2225.05 | - | 25.93 | 2.06 | 7.94 | -0.00 | -21.79 | -36.10 |
| CNH Industrial NV | CNHI:IM | United Kingdom
| Agricultural Machinery | 9513.04 | 2.07% | - | - | 0.00 | -0.00 | -24.18 | -20.50 |
| China Agri-Industries Holdings Ltd | 606:HK | Hong Kong (SAR)
| Agricultural Producers | 1840.94 | - | - | 0.17 | 0.00 | 0.00 | -17.90 | -14.22 |
| AGCO Corp | AGCO:US | United States
| Agricultural Machinery | 3865.00 | 1.11% | 20.38 | 0.54 | 2.65 | 22.62 | -15.07 | -6.50 |
xxxxxxxxxxxxxxxxxxxxxxxxxxxxxxxxxxx
xxxxxxxxxxxxxxxxxxxxxxxxxxxxxxxxxxx
Weekly Fund flow into Agri focused funds showed (Previous Week)-10.8 USD mn of outflow.
Top 10 Agri Focused Funds by Inflows Last Week
| Fund Name | fund flow mn$ | Total Assets mn$ | | POWERSHARES GLOBAL AGRICULTURE (PSUU) | 0.0 | 5.7 | | MIRAE ROGERS AGRICULTURAL PRODUCT INDEX SPECIAL ASSET INVEST CMDTY-DERIVATIVE (5620974) | -0.2 | 71.8 | | ETFS AGRICULTURE DJ-UBSCI (AIGA) | -3.5 | 233.4 |
Top 10 Agri Focused Funds by Outflow Last Week
| Fund Name | fund flow mn$ | Total Assets mn$ | | ETFS AGRICULTURE DJ-UBSCI (AIGA) | -3.5 | 233.4 | | MIRAE ROGERS AGRICULTURAL PRODUCT INDEX SPECIAL ASSET INVEST CMDTY-DERIVATIVE (5620974) | -0.2 | 71.8 | | POWERSHARES GLOBAL AGRICULTURE (PSUU) | 0.0 | 5.7 |
|
|