
Report: ML Fund Atlas - Weekly Fund Flow
Source: ML, BI
 You will be able to download all slides in power point for this report
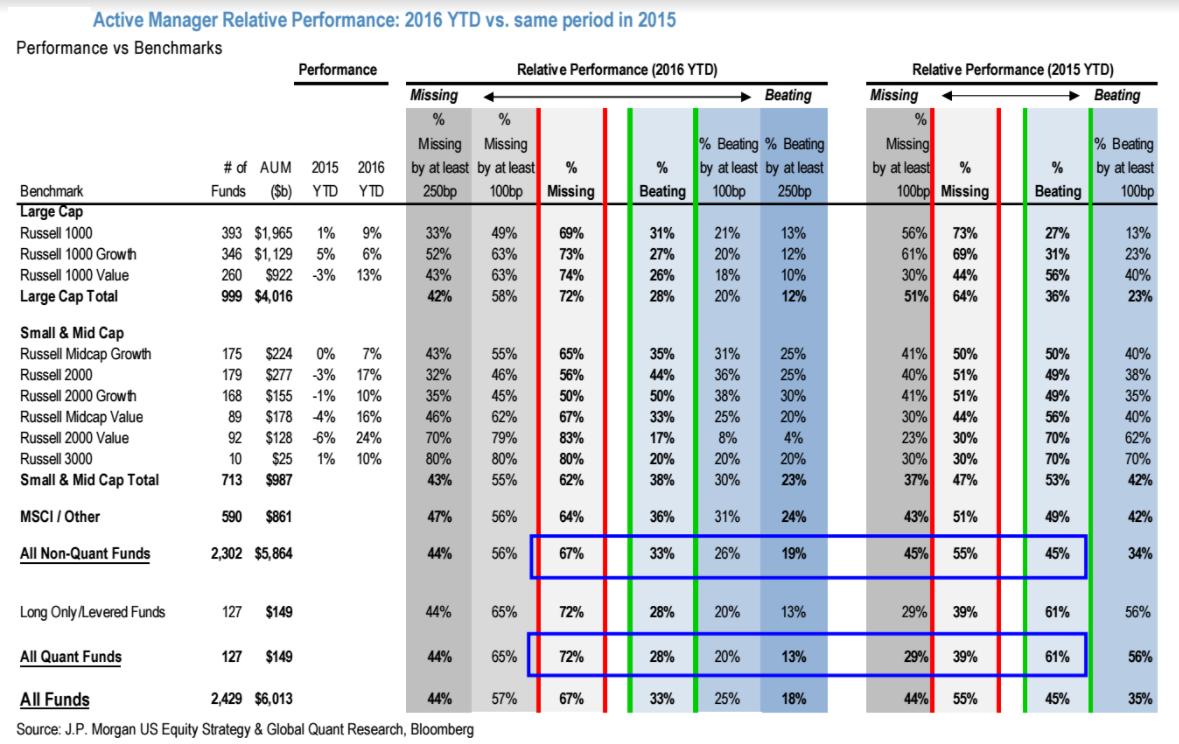
Chart: Distribution of Active Managers Beating Their Benchmark - within statistics. Just 1/3 of them are beating their benchmark. Source: ML, BI Emerging markets fund flow showed -572.6 USD mn of outflow.Emerging markets fund flow showed -0.7 USD mn of outflow.. While Frontier Markets funds showed -0.5 USD mn of outflows. BRAZIL Equity funds showed -39.8 USD mn of outflow. BRAZIL Fixed Income funds showed 34.2 USD mn of inflow. CHINA Equity funds showed -501.5 USD mn of outflow. CHINA Fixed Income funds showed -65.5 USD mn of outflow. INDIA Equity funds showed -239.1 USD mn of outflow. INDIA Fixed Income funds showed -29.6 USD mn of outflow. KOREA Equity funds showed -116.1 USD mn of outflow. RUSSIA Equity funds showed 426.4 USD mn of inflow. RUSSIA Fixed Income funds showed -7.7 USD mn of outflow. SOUTH AFRICA Equity funds showed -15.3 USD mn of outflow. TURKEY Equity funds showed -16.9 USD mn of outflow. COMMUNICATIONS SECTOR Equity funds showed -60.6 USD mn of outflow. ENERGY SECTOR Equity funds showed 60.3 USD mn of inflow. FINANCIAL SECTOR Equity funds showed 35.6 USD mn of inflow. REAL ESTATE SECTOR Alternative funds showed 5.1 USD mn of inflow. REAL ESTATE SECTOR Equity funds showed -33.6 USD mn of outflow. TECHNOLOGY SECTOR Equity funds showed 59.5 USD mn of inflow. UTILITIES SECTOR Equity funds showed -881.4 USD mn of outflow. LONG SHORT Alternative funds showed -200.3 USD mn of outflow. LONG SHORT Equity funds showed -409.7 USD mn of outflow. LONG SHORT Fixed Income funds showed 3.2 USD mn of inflow. LONG SHORT Mixed Allocation funds showed 0.4 USD mn of inflow.
Rural Investment Banking Coworking
Download ML Presentation

Get to know rural tunes .