Midlincoln Aggregates for funds
for week ending last Friday (inclusive)
| Focus | Objective | Asset Class | Flow USD mn | |
| Commodities | INDUSTRIAL METALS | Commodity | -7.04 | |
| Commodities | PRECIOUS METAL SECTOR | Equity | 116.07 | |
| Commodities | PRECIOUS METALS | Commodity | 912.43 | |
| Commodities | PRECIOUS METALS | Mixed Allocation | -0.04 | |
| country | AUSTRALIA | Equity | 21.53 | |
| country | AUSTRALIA | Fixed Income | -2.15 | |
| country | AUSTRALIA | Mixed Allocation | 0.00 | |
| country | BRAZIL | Equity | -16.12 | |
| country | BRAZIL | Fixed Income | -1226.30 | |
| country | CHINA | Equity | 300.90 | |
| country | CHINA | Fixed Income | -36.26 | |
| country | INDIA | Equity | 27.11 | |
| country | INDIA | Fixed Income | -10.64 | |
| country | ISRAEL | Equity | 0.02 | |
| country | JAPAN | Equity | -72454.13 | |
| country | JAPAN | Fixed Income | -1397.52 | |
| country | KOREA | Equity | 68.35 | |
| country | POLAND | Equity | 2.09 | |
| country | RUSSIA | Equity | 116.93 | |
| country | RUSSIA | Fixed Income | 3.84 | |
| country | SOUTH AFRICA | Equity | 0.25 | |
| country | SPAIN | Equity | -13.65 | |
| Country | TAIWAN | Equity | -23.46 | |
| country | TURKEY | Equity | -11.90 | |
| country | UNITED KINGDOM | Equity | 27.22 | |
| industry | BASIC MATERIALS SECTOR | Equity | 24.77 | |
| industry | COMMUNICATIONS SECTOR | Equity | 24.36 | |
| industry | ENERGY SECTOR | Equity | 562.47 | |
| industry | FINANCIAL SECTOR | Equity | 7.57 | |
| industry | HEALTH CARE SECTOR | Equity | 21.38 | |
| industry | INDUSTRIAL SECTOR | Equity | -4.58 | |
| industry | MULTIPLE SECTOR | Equity | 0.00 | |
| industry | NATURAL RESOURCES SECTOR | Equity | 50.67 | |
| industry | REAL ESTATE SECTOR | Alternative | -0.45 | |
| industry | REAL ESTATE SECTOR | Equity | 79.87 | |
| industry | TECHNOLOGY SECTOR | Equity | 22.41 | |
| industry | UTILITIES SECTOR | Equity | -51.02 | |
| region | AFRICAN REGION | Equity | -7.83 | |
| region | AFRICAN REGION | Fixed Income | -3.15 | |
| region | ASIAN PACIFIC REGION | Equity | 3.67 | |
| region | ASIAN PACIFIC REGION | Fixed Income | 97.71 | |
| region | ASIAN PACIFIC REGION EX JAPAN | Equity | -14.14 | |
| region | ASIAN PACIFIC REGION EX JAPAN | Fixed Income | -22.44 | |
| region | ASIAN PACIFIC REGION EX JAPAN | Mixed Allocation | -0.30 | |
| region | EASTERN EUROPEAN REGION | Equity | 18.04 | |
| region | EASTERN EUROPEAN REGION | Fixed Income | 0.42 | |
| region | EUROPEAN REGION | Equity | 452.56 | |
| region | EUROPEAN REGION | Fixed Income | -281.44 | |
| region | EUROPEAN REGION | Mixed Allocation | 0.13 | |
| region | LATIN AMERICAN REGION | Equity | -20.46 | |
| region | LATIN AMERICAN REGION | Fixed Income | -457.88 | |
| region | MIDDLE EAST REGION | Equity | -0.95 | |
| region | MIDDLE EAST REGION | Fixed Income | 0.28 | |
| region | NORDIC REGION | Equity | -6.50 | |
| region | NORTH AMERICAN REGION | Equity | -137.00 | |
| region | NORTH AMERICAN REGION | Fixed Income | -0.36 | |
| Risk | GOVERNMENT BOND | Fixed Income | -4.93 | |
| Risk | GOVERNMENT BOND | Mixed Allocation | 1.38 | |
| Risk | INFLATION PROTECTED | Brazil | -0.34 | |
| Risk | INFLATION PROTECTED | Fixed Income | 38.25 | |
| Risk | LONG SHORT | Alternative | 19.75 | |
| Risk | LONG SHORT | Equity | -2697.92 | |
| Risk | LONG SHORT | Fixed Income | 9.62 | |
| Risk | LONG SHORT | Mixed Allocation | 0.03 | |
| Sector | AGRICULTURE | Commodity | 0.40 | |
| Sector | AGRICULTURE | Equity | -0.06 | |
| Sector | CONSUMER DISCRETIONARY | Equity | -76.46 | |
| Sector | CONSUMER STAPLES | Equity | 51.33 | |
| segment | BRIC | Equity | -0.50 | |
| segment | BRIC | Fixed Income | -0.07 | |
| segment | DEVELOPED MARKETS | Equity | 1341.51 | |
| segment | EMEA | Equity | -0.66 | |
| segment | EMEA | Fixed Income | 0.33 | |
| segment | EMERGING MARKETS | Equity | 1131.05 | |
| segment | GCC | Equity | -4.34 | |
| segment | GCC | Mixed Allocation | -0.01 | |
| segment | MENA | Equity | -0.33 | |
| segment | MENA | Fixed Income | -7.67 | |
| Size | LARGE-CAP | Equity | -1520.90 | |
| Size | MID-CAP | Commodity | -0.08 | |
| Size | MID-CAP | Equity | 1086.17 | |
| Size | SMALL-CAP | Equity | 315.86 |
Source: Midlincoln Research
Fund Aggregates
Chart: Emerging Market Fund Flow Ticks Up
In the past such upticks meant good news for the markets
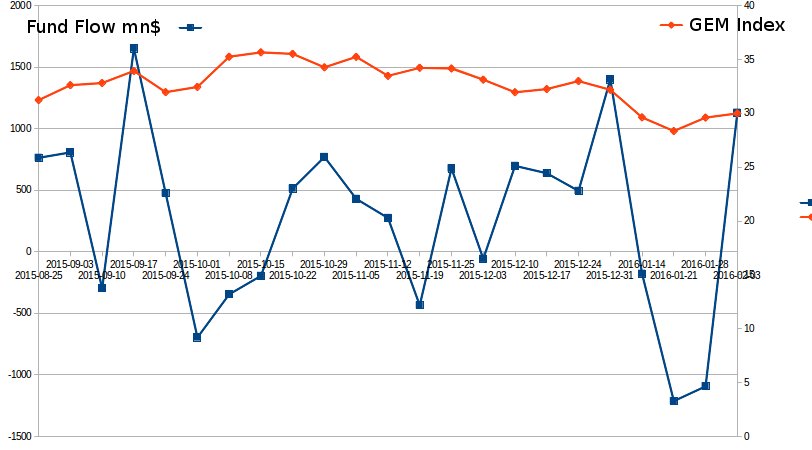
Source: MidLincoln Research
Emerging markets fund flow showed 1131.0 USD mn of inflow. While Frontier Markets funds showed 4.9 USD mn of inflows.
BRAZIL Equity funds showed -16.1 USD mn of outflow.
BRAZIL Fixed Income funds showed -1226.3 USD mn of outflow.
CHINA Equity funds showed 300.9 USD mn of inflow.
CHINA Fixed Income funds showed -36.3 USD mn of outflow.
INDIA Equity funds showed 27.1 USD mn of inflow.
INDIA Fixed Income funds showed -10.6 USD mn of outflow.
KOREA Equity funds showed 68.3 USD mn of inflow.
RUSSIA Equity funds showed 116.9 USD mn of inflow.
RUSSIA Fixed Income funds showed 3.8 USD mn of inflow.
SOUTH AFRICA Equity funds showed 0.3 USD mn of inflow.
TURKEY Equity funds showed -11.9 USD mn of outflow.
COMMUNICATIONS SECTOR Equity funds showed 24.4 USD mn of inflow.
ENERGY SECTOR Equity funds showed 562.5 USD mn of inflow.
FINANCIAL SECTOR Equity funds showed 7.6 USD mn of inflow.
REAL ESTATE SECTOR Alternative funds showed -0.4 USD mn of outflow.
REAL ESTATE SECTOR Equity funds showed 79.9 USD mn of inflow.
TECHNOLOGY SECTOR Equity funds showed 22.4 USD mn of inflow.
UTILITIES SECTOR Equity funds showed -51.0 USD mn of outflow.
LONG SHORT Alternative funds showed 19.7 USD mn of inflow.
LONG SHORT Equity funds showed -2697.9 USD mn of outflow.
LONG SHORT Fixed Income funds showed 9.6 USD mn of inflow.
LONG SHORT Mixed Allocation funds showed 0.0 USD mn of inflow.
It is worth noting that MidLincoln data shows flow dynamics for last week ending last Friday where as EPFR data reports data only to last Wednesday, which makes ML data far more relevant
Top 5 fund winners and Top 5 losers by country by inflow
Russia Inflows
| assclass | profile | flow USD mln$ | |
| Equity | HSBC Global Investment Funds - Russia Equity | 22.04 | |
| Equity | Market Vectors Russia ETF is an exchange-traded | 18.43 | |
| Equity | iShares MSCI Russi a ADR/GDR UCITS ETF | 18.26 | |
| Equity | LYXOR ETF RUSSIA (Dow Jones Russia GDR) - | 15.67 | |
| Equity | LYXOR ETF RUSSIA Dow Jones Russia GDR - D | 11.07 |
Russia Outflows
| assclass | profile | flow USD mln$ | |
| Equity | OTP Russia Equity Fund is an open-end investment | -2.15 | |
| Equity | Raiffeisen-Russland-Aktien is an open end | -0.85 | |
| Equity | Credit Suisse Lux Russia Equity Fund is | -0.76 | |
| Equity | The RBS Market Access DAXglobal� Russia Index | -0.76 | |
| Fixed Income | AMCFM Fund Russia Bonds is an open-end | -0.46 |
Source: MidLincoln Research
China Inflows
| assclass | profile | flow USD mln$ | |
| Equity | Hang Seng Investment Index Funds Series - | 99.99 | |
| Equity | CSOP FTSE China A50 ETF is an exchange-traded | 99.99 | |
| Equity | iShares China Large-Cap ETF is an exchange-traded | 99.99 | |
| Equity | W.I.S.E. - CSI 300 China Tracker� is an index-tracking | 18.04 | |
| Equity | ChinaAMC ETF Series - ChinaAMC CSI 300 Index | 17.93 |
China Outflows
| assclass | profile | flow USD mln$ | |
| Equity | UBS (Lux) Equity Fund - China Opportunity | -99.99 | |
| Equity | Robeco Chinese Equities is an open-end | -59.31 | |
| Equity | Robeco Chinese Equities is an open-end investment | -41.25 | |
| Equity | HSBC Global Investment Funds - Chinese | -23.36 | |
| Equity | First State Global Umbrella PLC - China | -17.01 |
Source: MidLincoln Research
South Africa Inflows
| assclass | profile | flow USD mln$ | |
| Equity | NEXT FUNDS FTSE/JSE Africa Top40 Linked Exchange | 0.59 | |
| Equity | NEXT FUNDS FTSE/JSE Africa Top40 Linked | 0.00 | |
| Equity | iShares MSCI South Africa UCITS ETF is an | -0.34 |
South Africa Outflows
| assclass | profile | flow USD mln$ | |
| Equity | iShares MSCI South Africa UCITS ETF is an | -0.34 | |
| Equity | NEXT FUNDS FTSE/JSE Africa Top40 Linked | 0.00 | |
| Equity | NEXT FUNDS FTSE/JSE Africa Top40 Linked Exchange | 0.59 |
Source: MidLincoln Research
Korea Inflows
| assclass | profile | flow USD mln$ | |
| Equity | iShares MSCI South Korea Capped ETF is an | 56.73 | |
| Equity | Korea Equity Fund, Inc. is a non-diversified, | 9.73 | |
| Equity | JPMorgan Funds - Korea Equity is an open-end | 3.55 | |
| Equity | INVESCO Korean Equity Fund is a UCITS certified | 2.94 | |
| Equity | INVESCO Korean Equity Fund is a UCITS | 2.82 |
Korea Outflows
| assclass | profile | flow USD mln$ | |
| Equity | Deutsche X-trackers MSCI South Korea Hedged | -12.46 | |
| Equity | KIM Investment Funds - Korea Value Fund | -0.71 | |
| Equity | JPMorgan Funds - Korea Equity is an open-end | -0.34 | |
| Equity | iShares MSCI Korea UCITS ETF (Dist) is an | -0.09 | |
| Equity | KIM Investment Funds - Korea Navigator | -0.08 |
Source: MidLincoln Research
India Inflows
| assclass | profile | flow USD mln$ | |
| Equity | iShares MSCI India ETF is an exchange-traded | 99.99 | |
| Equity | HSBC Global Investment Funds - Indian Equity | 33.45 | |
| Equity | AllianceBernstein - India Growth Portfolio | 22.62 | |
| Equity | iShares India 50 ETF is an exchange-traded | 18.95 | |
| Equity | Kotak Funds - India Midcap Fund is a SICAV | 11.35 |
India Outflows
| assclass | profile | flow USD mln$ | |
| Equity | WisdomTree India Earnings Fund is an exchange-traded | -32.23 | |
| Equity | Pictet - Indian Equities is an open-end fund | -29.94 | |
| Equity | Invesco Funds SICAV - India Equity Fund is | -23.13 | |
| Equity | Jupiter JGF - India Select is an open-end | -15.16 | |
| Equity | The Lyxor ETF MSCI India is a UCITS compliant | -13.79 |
Source: MidLincoln Research
Turkey Inflows
| assclass | profile | flow USD mln$ | |
| Equity | db x-trackers MSCI Turkey Index UCITS ETF | 0.33 | |
| Equity | iShares MSCI Turkey UCITS ETF is an open-end, | -0.79 | |
| Equity | The Lyxor ETF Turkey (DJ Turkey Titans 20) | -11.44 |
Turkey Outflows
| assclass | profile | flow USD mln$ | |
| Equity | The Lyxor ETF Turkey (DJ Turkey Titans 20) | -11.44 | |
| Equity | iShares MSCI Turkey UCITS ETF is an open-end, | -0.79 | |
| Equity | db x-trackers MSCI Turkey Index UCITS ETF | 0.33 |
Source: MidLincoln Research
Brazil Inflows
| assclass | profile | flow USD mln$ | |
| Fixed Income | HSBC Global Investment Funds - Brazil Bond | 2.62 | |
| Equity | Direxion Daily Brazil Bull 3x Shares is an | 1.90 | |
| Equity | AMUNDI ETF MSCI BRAZIL is an exchange-traded | 1.46 | |
| Equity | JPMorgan Funds - Brazil Equity is an open-end | 1.02 | |
| Equity | JPMorgan Funds - Brazil Equity is an open-end | 0.97 |
Brazil Outflows
| assclass | profile | flow USD mln$ | |
| Fixed Income | Fondo Mutuo Security Fixed Income BRL is | -99.99 | |
| Equity | Lyxor ETF Brazil (Ibovespa) USD is an exchange | -7.20 | |
| Equity | iShares MSCI Brazil UCITS ETF (Dist) is an | -5.24 | |
| Equity | Shinhan BNP Bonjour Brazil Investment Trust | -3.11 | |
| Equity | Fondo de Inversion iFund MSCI Brazil Small | -1.82 |
Source: MidLincoln Research
Australia Inflows
| assclass | profile | flow USD mln$ | |
| Equity | Swisscanto AST Avant Aktien Ausland Index | 20.51 | |
| Equity | Baring International Umbrella - Baring Australia | 8.96 | |
| Equity | Australia Equity Income Fund is an open-end | 4.34 | |
| Equity | Baring International Umbrella - Baring Australia | 1.22 | |
| Equity | NESTOR Australien Fonds is an open-end investment | 0.41 |
Australia Outflows
| assclass | profile | flow USD mln$ | |
| Equity | iShares MSCI Australia UCITS ETF is an open-end, | -4.72 | |
| Equity | Candriam Equities L - Australia is a SICAV | -4.35 | |
| Equity | Baring International Umbrella - Baring | -2.16 | |
| Fixed Income | -1.95 | ||
| Equity | db x-trackers S&P/ASX 200 UCITS ETF (DR) | -1.51 |
Source: MidLincoln Research
Canada Inflows
Canada Outflows
Source: MidLincoln Research
Good luck! And don’t stay out of the market for too long. As the policy of being too cautious is the greatest risk of all.
Ovanes Oganisyan