Midlincoln Aggregates for funds
for week ending last Friday (inclusive)
| Focus | Objective | Asset Class | Flow USD mn | |
| Commodities | INDUSTRIAL METALS | Commodity | 0.00 | |
| Commodities | PRECIOUS METALS | Commodity | 0.22 | |
| country | BRAZIL | Equity | 0.03 | |
| country | CHINA | Equity | 0.28 | |
| country | CHINA | Fixed Income | -53.58 | |
| country | INDIA | Equity | 0.00 | |
| country | JAPAN | Equity | -12352.88 | |
| country | RUSSIA | Equity | -14.20 | |
| country | SPAIN | Equity | -3.01 | |
| country | UNITED KINGDOM | Equity | 3.86 | |
| industry | BASIC MATERIALS SECTOR | Equity | 19.50 | |
| industry | ENERGY SECTOR | Equity | 41.27 | |
| industry | HEALTH CARE SECTOR | Equity | -103.52 | |
| industry | INDUSTRIAL SECTOR | Equity | 0.52 | |
| industry | NATURAL RESOURCES SECTOR | Equity | -0.56 | |
| industry | REAL ESTATE SECTOR | Equity | 44.43 | |
| industry | TECHNOLOGY SECTOR | 0 | -1.60 | |
| industry | TECHNOLOGY SECTOR | Equity | 5.91 | |
| industry | UTILITIES SECTOR | Equity | 4.93 | |
| region | AFRICAN REGION | Equity | 0.10 | |
| region | ASIAN PACIFIC REGION | Equity | -0.51 | |
| region | ASIAN PACIFIC REGION EX JAPAN | Equity | 6.12 | |
| region | EASTERN EUROPEAN REGION | Equity | -0.52 | |
| region | EUROPEAN REGION | Equity | -58.86 | |
| region | EUROPEAN REGION | Fixed Income | 42.90 | |
| region | LATIN AMERICAN REGION | 0 | 0.00 | |
| region | NORTH AMERICAN REGION | Equity | 1.08 | |
| Risk | GOVERNMENT BOND | Fixed Income | -183.10 | |
| Risk | INFLATION PROTECTED | Fixed Income | 0.01 | |
| Risk | LONG SHORT | Alternative | 1.34 | |
| Risk | LONG SHORT | Equity | -3.87 | |
| Sector | AGRICULTURE | Commodity | 0.01 | |
| Sector | CONSUMER DISCRETIONARY | Equity | -0.23 | |
| segment | BRIC | Equity | 0.00 | |
| segment | DEVELOPED MARKETS | Equity | -3.35 | |
| segment | EMERGING MARKETS | Equity | 21.92 | |
| segment | MENA | Equity | -0.09 | |
| segment | MENA | Fixed Income | -0.87 | |
| Size | LARGE-CAP | Equity | -127.12 | |
| Size | MID-CAP | Equity | 1.05 | |
| Size | SMALL-CAP | Equity | 23.52 |
Source: Midlincoln Research
Fund Aggregates
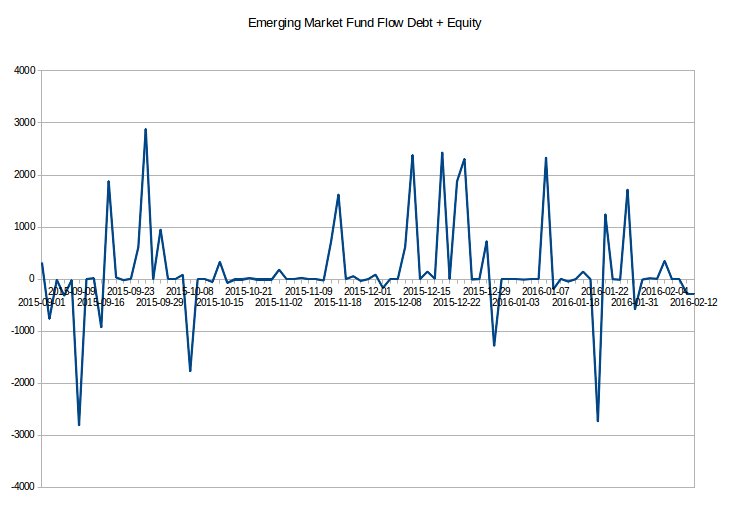
Chart: Emerging Markets Funds - Outflows Less
Emerging Markets Total Fund FLows still in negative zone, but equities show small inflow.
Source:
Emerging markets fund flow showed 21.9 USD mn of inflow. While Frontier Markets funds showed USD mn of inflows.
BRAZIL Equity funds showed 0.0 USD mn of inflow.
CHINA Equity funds showed 0.3 USD mn of inflow.
CHINA Fixed Income funds showed -53.6 USD mn of outflow.
INDIA Equity funds showed 0.0 USD mn of inflow.
RUSSIA Equity funds showed -14.2 USD mn of outflow.
ENERGY SECTOR Equity funds showed 41.3 USD mn of inflow.
REAL ESTATE SECTOR Equity funds showed 44.4 USD mn of inflow.
TECHNOLOGY SECTOR 0 funds showed -1.6 USD mn of outflow.
TECHNOLOGY SECTOR Equity funds showed 5.9 USD mn of inflow.
UTILITIES SECTOR Equity funds showed 4.9 USD mn of inflow.
LONG SHORT Alternative funds showed 1.3 USD mn of inflow.
LONG SHORT Equity funds showed -3.9 USD mn of outflow.
It is worth noting that MidLincoln data shows flow dynamics for last week ending last Friday where as EPFR data reports data only to last Wednesday, which makes ML data far more relevant
Top 5 fund winners and Top 5 losers by country by inflow
Russia Inflows
| assclass | profile | flow USD mln$ | |
| Equity | Direxion Daily Russia Bear 3x Shares is an | 3.32 | |
| Equity | db x-trackers MSCI Russia Capped Index UCITS | -0.08 | |
| Equity | Direxion Daily Russia Bull 3x Shares is an | -4.44 | |
| Equity | LYXOR ETF RUSSIA Dow Jones Russia GDR - D | -13.01 |
Russia Outflows
| assclass | profile | flow USD mln$ | |
| Equity | LYXOR ETF RUSSIA Dow Jones Russia GDR - D | -13.01 | |
| Equity | Direxion Daily Russia Bull 3x Shares is an | -4.44 | |
| Equity | db x-trackers MSCI Russia Capped Index UCITS | -0.08 | |
| Equity | Direxion Daily Russia Bear 3x Shares is an | 3.32 |
Source: MidLincoln Research
China Inflows
| assclass | profile | flow USD mln$ | |
| Equity | Fubon SSE 180 Index ETF is an exchange-traded | 11.19 | |
| Equity | W.I.S.E. Yuanta/P-shares CSI 300 ETF is an | 7.89 | |
| Equity | db x-trackers HSI Short Index UCITS ETF is short | 3.08 | |
| Equity | Yuanta/P-shares SSE50 Securities Investment | 2.64 | |
| Equity | Guggenheim China Small Cap Index ETF is an | 0.79 |
China Outflows
| assclass | profile | flow USD mln$ | |
| Equity | Hang Seng Investment Index Funds Series - | -24.01 | |
| Fixed Income | Deutsche Invest I China Bonds is an open-end | -18.46 | |
| Fixed Income | Deutsche Invest I China Bonds is an open-end | -18.38 | |
| Fixed Income | Deutsche Invest I China Bonds is an open-end | -16.74 | |
| Equity | Fuh Hwa CSI 300 A Shares ETF is an exchange-traded | -1.05 |
Source: MidLincoln Research
South Africa Inflows
South Africa Outflows
Source: MidLincoln Research
Korea Inflows
Korea Outflows
Source: MidLincoln Research
India Inflows
| assclass | profile | flow USD mln$ | |
| Equity | KB India Securities Master Investment Trust | 0.00 | |
| Equity | KB India Securities Investment Trust (Equity) | 0.00 |
India Outflows
| assclass | profile | flow USD mln$ | |
| Equity | KB India Securities Master Investment Trust | 0.00 | |
| Equity | KB India Securities Investment Trust (Equity) | 0.00 |
Source: MidLincoln Research
Turkey Inflows
Turkey Outflows
Source: MidLincoln Research
Brazil Inflows
| assclass | profile | flow USD mln$ | |
| Equity | KB Brazil Securities Master Investment | 0.03 |
Brazil Outflows
| assclass | profile | flow USD mln$ | |
| Equity | KB Brazil Securities Master Investment | 0.03 |
Source: MidLincoln Research
Australia Inflows
Australia Outflows
Source: MidLincoln Research
Canada Inflows
Canada Outflows
Source: MidLincoln Research
Good luck! And don’t stay out of the market for too long. As the policy of being too cautious is the greatest risk of all.
Ovanes Oganisyan