Strategy
MidLincoln Emerging Markets Chart Art
Mining for Emerging Markets Ideas


Some Popular Charts
Charts
Charts
This chart comes from SocGena and India Business Insider
SocGen's swan chart is trying to show that
This chart comes from SocGena and India Business Insider
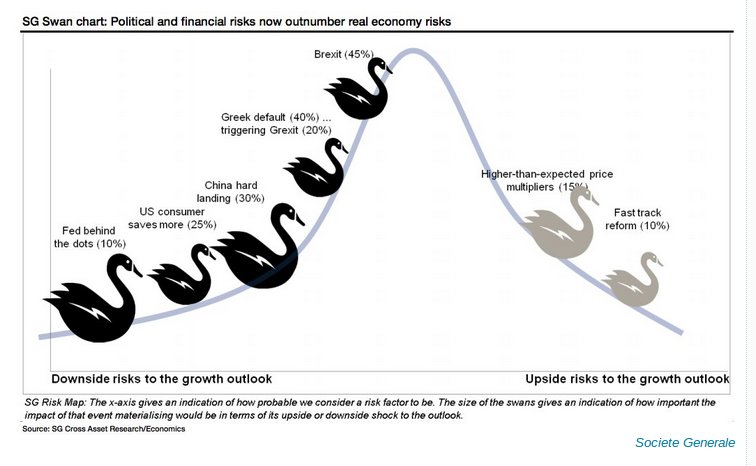
SocGen's swan chart is trying to show that there are more economic and geopolitical risks then rewards and that could could seriously rock the economy and the markets if these risks occur.
This time around, Europe is front and center for political risks. "As we head to press, the risk of a Greek default and possibly Grexit remains very real," according to SocGen. "Medium-term, our concern is that the UK referendum on EU membership (by end-2017) could see a Brexit."
Another risk is China hard landing, aka GDP growth falling below 5%, which could happen following a "miscalculation of how much financial risk management or structural reform the system can handle," according to SocGen.
On the positive end, there are two upside risks: higher-than-expected multipliers, which means investors will pay a higher premium for stocks despite lackluster earnings, and the possibility of fast track reform, especially in the euro area.
Source:MidLincoln
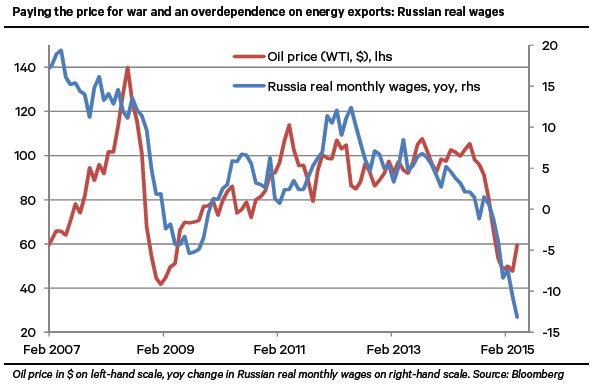
Chart today shows the pain that Russians undertake for their shortsighted strategy in eastern Ukraine and as a result of overdependance on oil ( it comes from mis Fortune Magazine).The chart's author, Berenberg Bank's chief economist Holger Schmieding, concedes that the blue line isn't going to get much worse from here, barring some unforeseen disaster. 'But,' he says, 'my rough guess is that Russia needs an oil price of over $80 a barrel to generate meaningful growth and a noticeable rise in living standards.'
Chart today shows the pain that Russians undertake for their shortsighted strategy in eastern Ukraine and as a result of overdependance on oil ( it comes from mis Fortune Magazine).The chart's author, Berenberg Bank's chief economist Holger Schmieding, concedes that the blue line isn't going to get much worse from here, barring some unforeseen disaster. 'But,' he says, 'my rough guess is that Russia needs an oil price of over $80 a barrel to generate meaningful growth and a noticeable rise in living standards.'
Source:MidLincoln
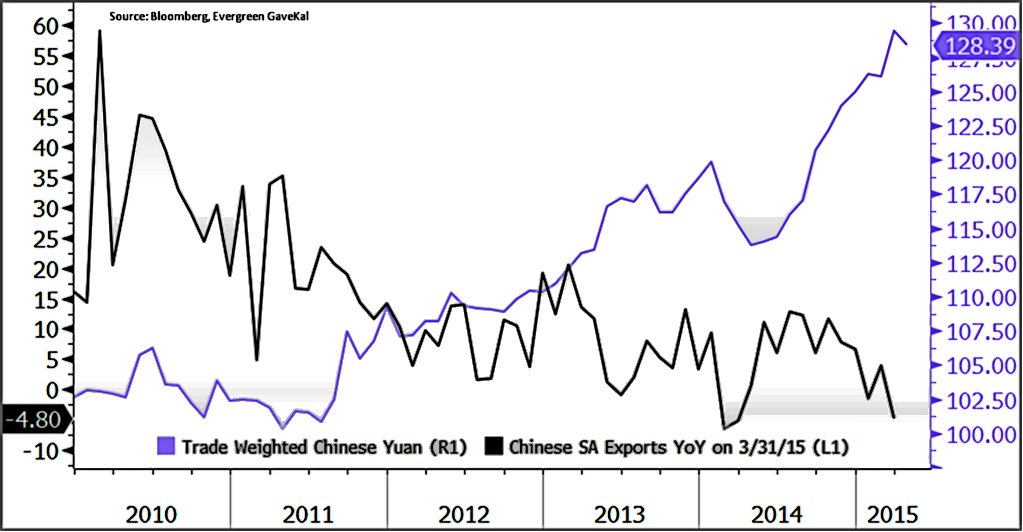
While nominal yuan is quite weak, trade weighted yuan goes from strength to strength
While nominal yuan is quite weak, trade weighted yuan goes from strength to strength

Source:MidLincoln
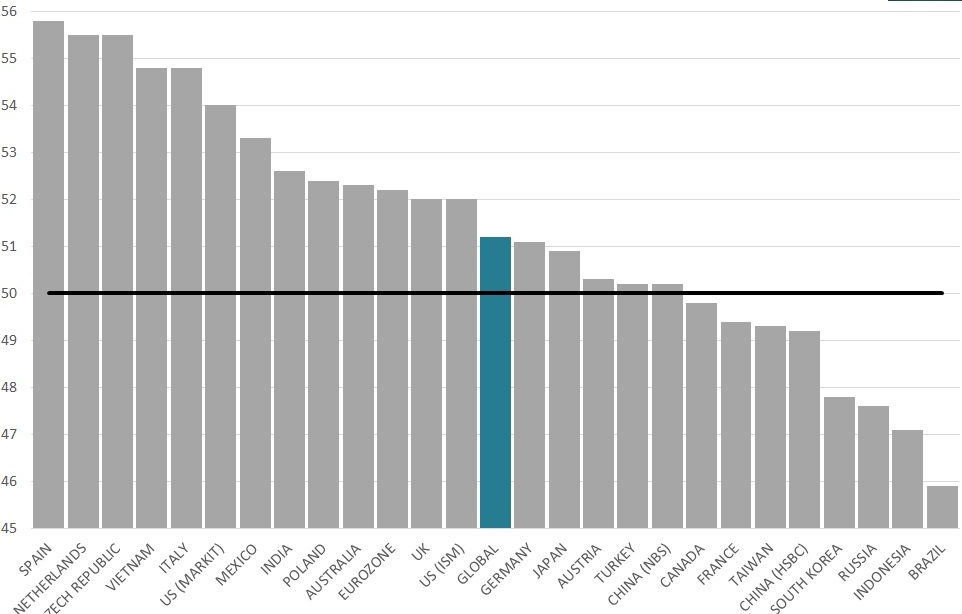
Spain tops the list with a PMI reading of 55.8 while Brazil, a near-perennial underachiever, brings up the rear at 45.9.
(from businessinsider.com.au)
Spain tops the list with a PMI reading of 55.8 while Brazil, a near-perennial underachiever, brings up the rear at 45.9.
(from businessinsider.com.au)
Source:MidLincoln
Emerging Market Commodities producers face similar problems.. Here they are explained with few chart
Emerging Market Commodities producers face similar problems.. Here they are explained with few charts using South Africa as an Example (This comes from seekingalpha.com).
2008 crisis is really at the root of the problem. Stimulus-driven growth was very short-lived, as evidenced by negative wage growth and real GDP growth trending lower since 2010 (Chart 1).
With inflation moving higher and a growing budget deficit forcing South Africa to take on more debt, the government's fiscal and monetary stimulus options are limited (Chart 2).
The drop in global commodity prices is a net negative for commodity producers and SA as an example given the country's natural resource base and its large mining sector.
Like in may GEM commodities producers from 2003 to 2008, household debt-to-disposable income levels jumped from 53% to 83% (Chart 3).
This additional borrowing was mainly used to subsidize incomes, allowing consumers to spend significantly more than they earned over the past decade Chart 4
Absent savings, consumer spending in South Africa has been supported mainly by credit growth, especially in the low-income segment. Unsecured lending, is now most closely aligned with consumer credit issues, has ballooned, growing over 400% since 2008. Credit problems are starting to surface - today.
close to half of credit-active consumers are impaired, with only 42% of accounts classified as current (Chart 5). Bottom line is that GEM commodities producers retailers are at risk.

Source:MidLincoln
Chart which comes from Hurriyet Daily News and albawaba.com shows that
Sunday's election in Turkey
Chart which comes from Hurriyet Daily News and albawaba.com shows that
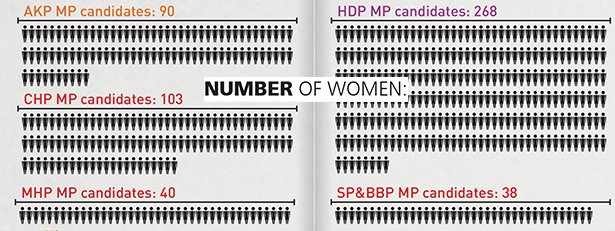
Sunday's election in Turkey was historic in another way ' more female delegates were elected than ever before, from 79 in 2011 to Sunday's 96. And it's thanks largely to the HDP, whose 79 parliamentary seats will be filled by 31 ladies.
Source:MidLincoln
Chart:
Brazil is pretty close to the bottom. April industrial production figures surprised slightly
Chart:
Brazil is pretty close to the bottom. April industrial production figures surprised slightly on the upside, but still declined by 1.2% from March. IP is down 7.6% from April of last year. And year-to-date, IP is down 6.3%. It's likely now that Brazilian companies will at least plateau and then pick up the slack. (sources: Frobes, BarCap)

Source:MidLincoln
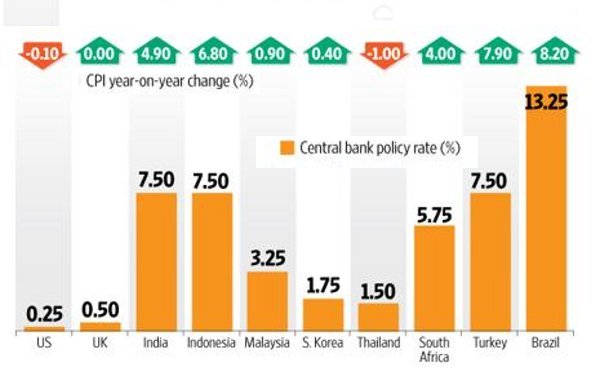
Turkey is one of the few places with negative real rates. (source: livemint.com)
Turkey is one of the few places with negative real rates. (source: livemint.com)
Source:MidLincoln
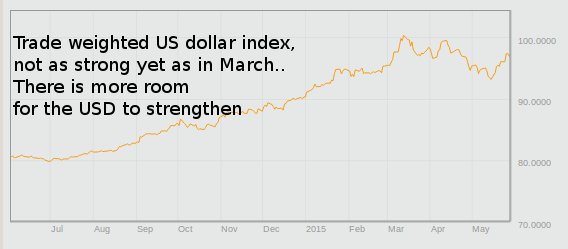
Dollar has more room to grow.
Dollar has more room to grow.

Source:MidLincoln
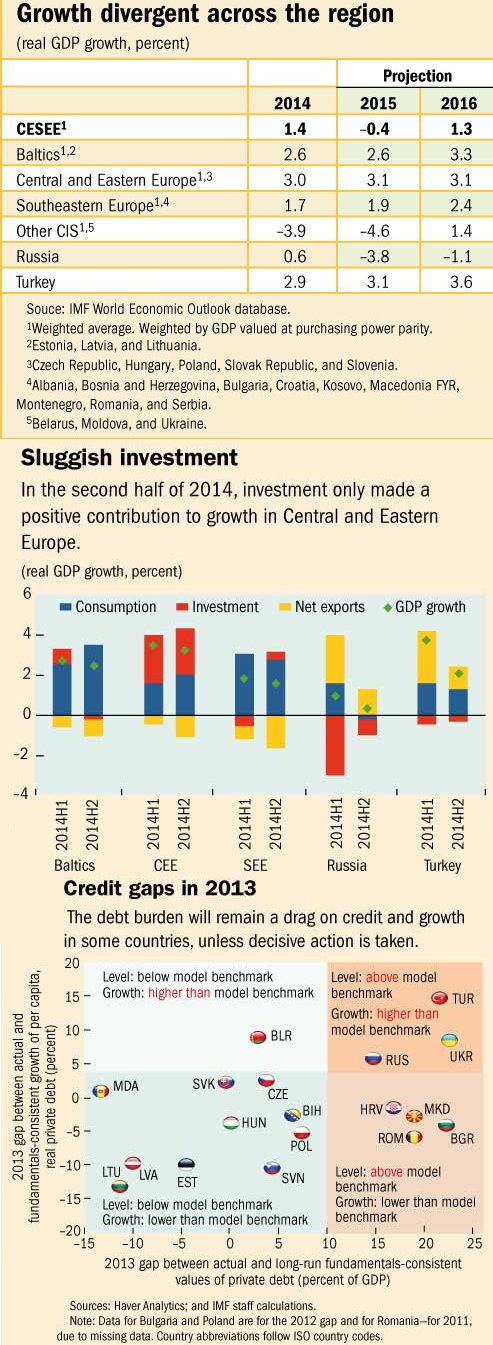
Chart today comes from a recent IMF report on Central and Eastern Europe
where policies should aim
Chart today comes from a recent IMF report on Central and Eastern Europe
where policies should aim to support the recovery and address excessive private sector debt, the report says. Some countries need urgent progress on the structural reform agenda to escape the debt trap and sub-par medium-term growth.
A positive 'credit gap' exists when private debt is high, compared to a country's fundamentals ' its GDP and nominal interest rates. Post-crisis deleveraging efforts have not managed to close the gap in many countries. At the end of 2013, credit gaps were still wide in several SEE countries, Ukraine, Russia, and Turkey. Firms in these countries are also typically more exposed to liquidity or solvency risks.
Projections of the credit gap into the medium-term suggest that the debt burden will remain a drag on credit and growth in some countries, unless decisive action is taken. This is particularly true for Bulgaria, Croatia, and Ukraine.

Source:MidLincoln
This time around, Europe is front and center for political risks. "As we head to press, the risk of a Greek default and possibly Grexit remains very real," according to SocGen. "Medium-term, our concern is that the UK referendum on EU membership (by end-2017) could see a Brexit."
Another risk is China hard landing, aka GDP growth falling below 5%, which could happen following a "miscalculation of how much financial risk management or structural reform the system can handle," according to SocGen. On the positive end, there are two upside risks: higher-than-expected multipliers, which means investors will pay a higher premium for stocks despite lackluster earnings, and the possibility of fast track reform, especially in the euro area.
2008 crisis is really at the root of the problem. Stimulus-driven growth was very short-lived, as evidenced by negative wage growth and real GDP growth trending lower since 2010 (Chart 1).
With inflation moving higher and a growing budget deficit forcing South Africa to take on more debt, the government's fiscal and monetary stimulus options are limited (Chart 2).
The drop in global commodity prices is a net negative for commodity producers and SA as an example given the country's natural resource base and its large mining sector. Like in may GEM commodities producers from 2003 to 2008, household debt-to-disposable income levels jumped from 53% to 83% (Chart 3).
This additional borrowing was mainly used to subsidize incomes, allowing consumers to spend significantly more than they earned over the past decade Chart 4
Absent savings, consumer spending in South Africa has been supported mainly by credit growth, especially in the low-income segment. Unsecured lending, is now most closely aligned with consumer credit issues, has ballooned, growing over 400% since 2008. Credit problems are starting to surface - today.
close to half of credit-active consumers are impaired, with only 42% of accounts classified as current (Chart 5). Bottom line is that GEM commodities producers retailers are at risk.
A positive 'credit gap' exists when private debt is high, compared to a country's fundamentals ' its GDP and nominal interest rates. Post-crisis deleveraging efforts have not managed to close the gap in many countries. At the end of 2013, credit gaps were still wide in several SEE countries, Ukraine, Russia, and Turkey. Firms in these countries are also typically more exposed to liquidity or solvency risks. Projections of the credit gap into the medium-term suggest that the debt burden will remain a drag on credit and growth in some countries, unless decisive action is taken. This is particularly true for Bulgaria, Croatia, and Ukraine.